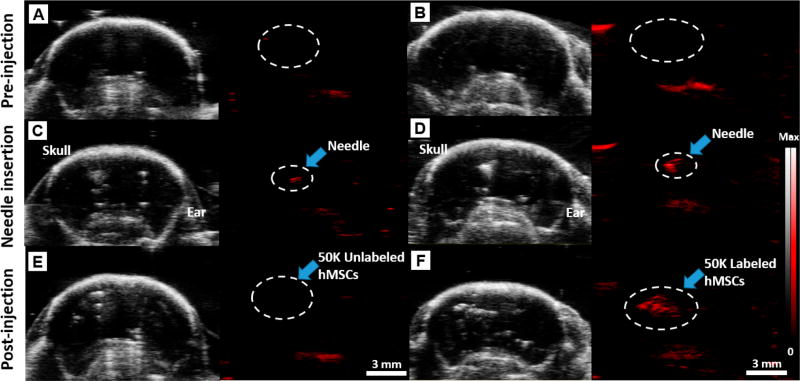
Figure 7. Deep tissue imaging.
B-mode ultrasound (gray scale) and photoacoustic (red) images of 50 × 103 unlabeled (A, C, E) and labeled hMSCs (B, D, F) injected into a murine brain. Images were taken preinjection (A, B), after needle insertion (C, D), and postinjection of the cells (E, F). The significant photoacoustic signal increase (980%) pre- and postinjection of the labeled cells at the injection site (white dashed circle) is shown in F relative to B. In contrast, no photoacoustic signals were detected postinjection of unlabeled cells (white dashed circle) in E. Scale bar is 3 mm. Real-time injection imaging of labeled hMSCs (50 × 103) is shown in the Supporting Information, Supplementary Movie SM 1.

