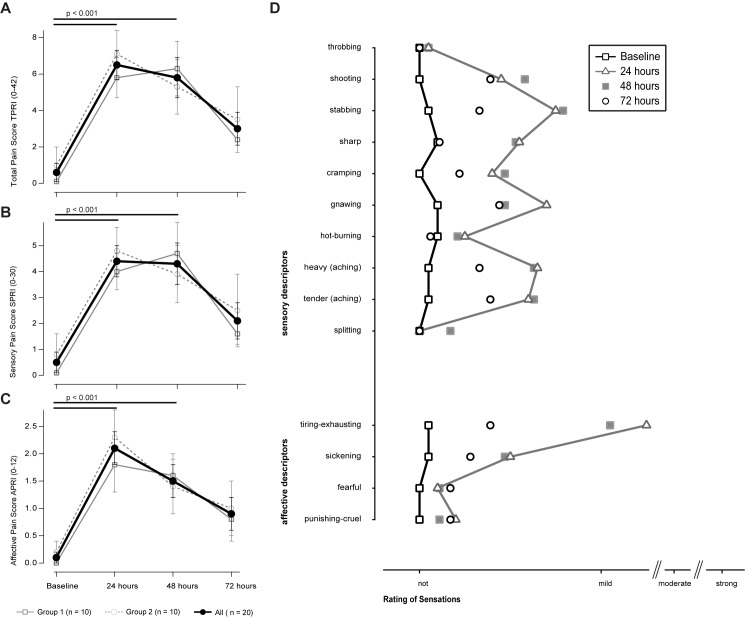
Fig 3.
A-D display the rating of pain perception on the short-form MQP. (A)-(C) shows the mean change ± SEM at baseline and 24, 48 and 72 hours after induction of DOMS of the Total (A), Sensory (B) and Affective (C) Pain Score. D lists the used descriptors ranging from not to strong at the 4 time points. Descriptors at baseline and after 24 hours were connected with lines for a better visualization. Black lines with p-values indicate the post-hoc tests between two times in case that repeated measures ANOVA detected significant effects x time. No between group differences (i.e. sequence of sensory testings) could be observed (refer to the text).

