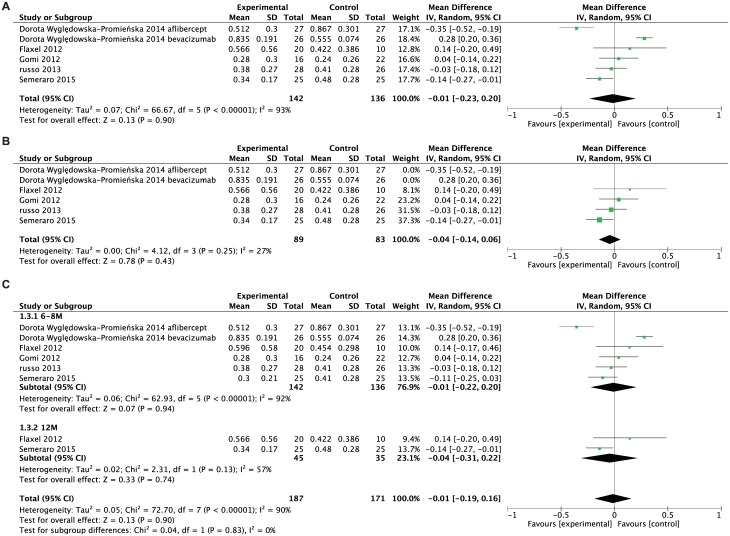
Fig 3. Forest plot showing weighted mean difference of BCVA comparing combined treatment and anti-VEGF alone.
A. Pooled data computed the BCVA at the end point between study and control group by using the random effects model. B. Pooled data showed the results did not change after removing two quasi-RCTs. C. Data was grouped by follow-up duration (6–8 months and 12 months).

