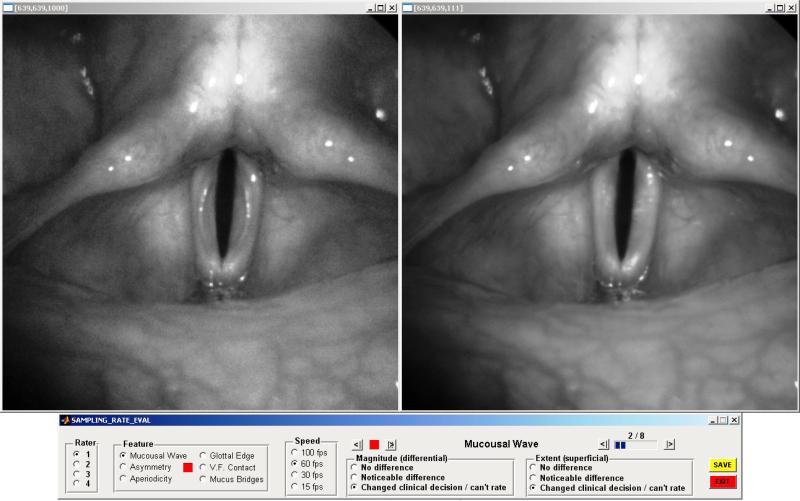
Figure 1.
Customized software graphic interface used in Stage 1 of the study, which allowed users to compare the reference video on the left (16000 fps) to the downsampled video on the right. Note the mucosal wave is visible on the left, but is not visible on the right. The electronic version of the article contains videos demonstrating the degradation of the mucosal wave feature shown in this figure, including a short video sequence of the 16000-fps reference and 3 corresponding downsampled denominations at: 8000 fps, 4000 fps and 2000 fps.

