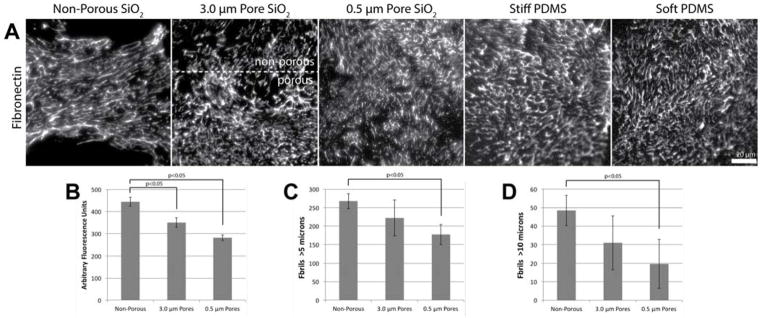
Figure 3.
(A) Representative images of endothelial fibronectin fibrillogenesis after 24 hours on non-porous, 3.0 μm and 0.5 μm pore diameter SiO2 membranes, 2 MPa (Stiff) PDMS and 5 kPa (Soft) PDMS substrates. The image of the 3.0 μm pore diameter SiO2 membrane shows the boundary between the porous and non-porous regions. (B) Fibronectin density on each SiO2 membrane substrate was approximated by measuring the mean fluorescence intensity of anti-fibronectin antibody within 100×100 μm regions of interest that were occupied by cells (n > 15 for each substrate). (C) and (D) Fibronectin fibril lengths were also measured using an automated image processing algorithm (comparisons were made using one-way ANOVA with a Tukey post hoc analysis).

