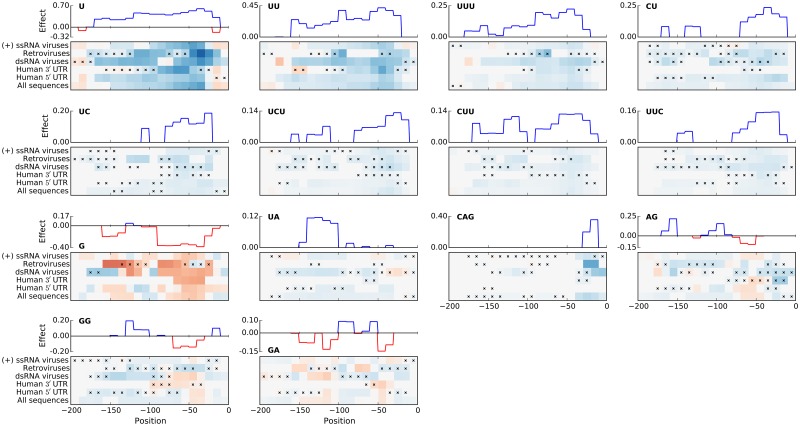
Fig 5. Robust and predictive positional features that appear in at least two of the analysed groups.
For each feature, its effect along sequences is shown in a heat map (see Fig 3), and summarised as a consensus effect (located above each of the heat maps) across several groups, chosen as the effect whose directionality and importance are confirmed by at least two groups. Horizontal axes show feature window position relative to the start AUG.

