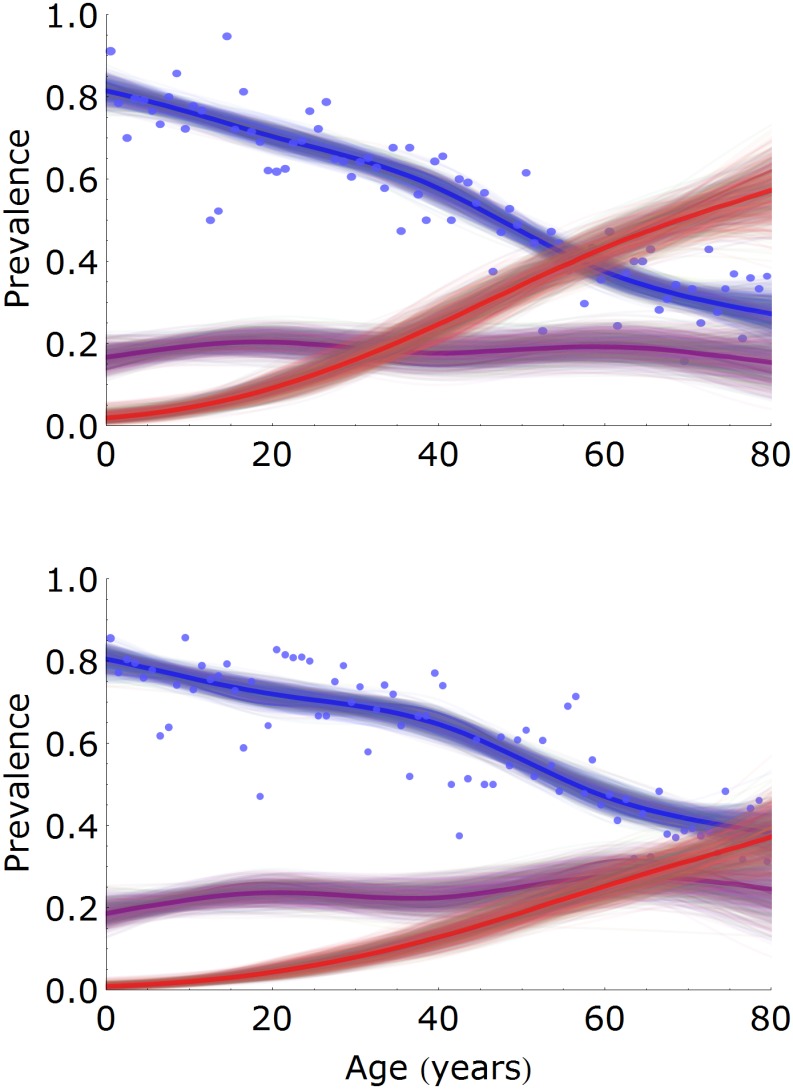
Fig 4. Estimation of age- and sex-specific prevalence.
Prevalence estimates are presented for females (top panel) and males (bottom panel), and for classes of low (susceptible, blue), intermediate (latently infected, purple), and high (latently infected with increased antibodies, red) antibody measurements. Shown are 1,000 samples from the posterior distribution (thin lines) with posterior medians (bold lines). Dots indicate the fraction of samples that would be classified as uninfected with the cut-off specified by the supplier of the assay. The number of samples per 1-year age group is approximately 35 (females) and 30 (males).

