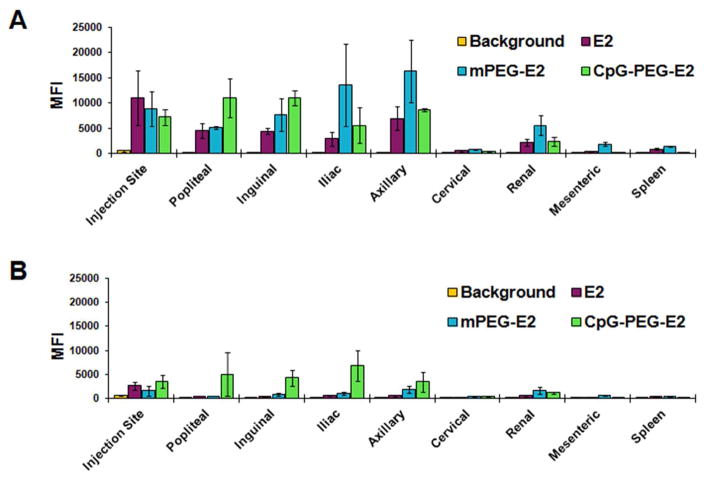
Figure 3.
Distribution of nanoparticles in the lymph nodes ipsilateral to injection site, mesenteric lymph node, and spleen following injection, after (A) 6 hours and (B) 48 hours. E2, mPEG-E2, and CpG-PEG-E2 nanoparticles were administered subcutaneously. Mean fluorescence (MFI) was measured by flow cytometry of cells from relevant tissues, and background is tissue MFI from PBS-injected mice. Data is presented as average ± S.E.M. of 3 independent experiments.

