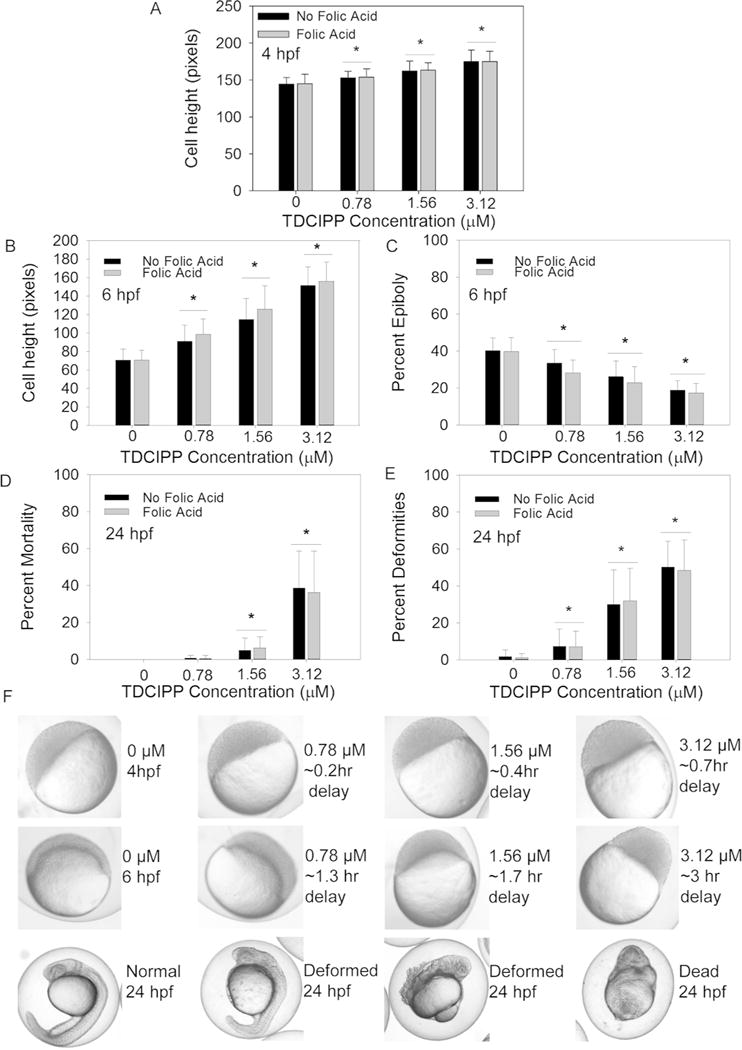
Figure 1.

Developmental impacts of vehicle (0.1% DMSO) or TDCIPP (0.78, 1.56, or 3.12 μM) in the presence or absence of 1 mM FA on (A) cell height at 4 hpf; (B) cell height at 6 hpf; (C) percent epiboly at 6 hpf; (D) percent mortality at 24 hpf; and (E) percent deformities at 24 hpf. (F) Representative images of epiboly delays at 4 and 6 hpf and deformities at 24 hpf (embryos are approximately 0.7 mm in diameter). Data are presented as mean ± standard deviation. Black bars represent TDCIPP-only treatments in EM, while gray bars represent TDCIPP treatments containing 1 mM FA. Asterisks denote significant differences (p≤0.05) within TDCIPP treatments (with or without FA) relative to respective vehicle controls. For 4- and 6-hpf data, a total of 30 total embryos were imaged across three replicate beakers (10 embryos per beaker; for 24-hpf data, mean percentages are based on nine beakers containing 20 imaged embryos per beaker.
