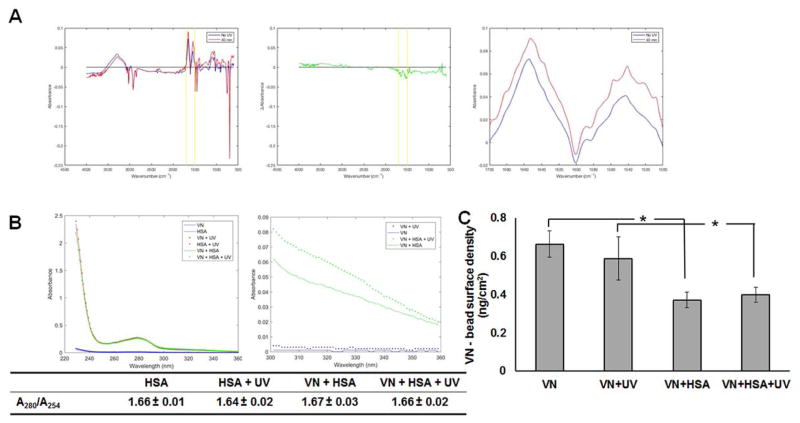
Figure 2.
Characterization of engineered microcarriers. (A) FTIR analysis of VN+HSA microcarriers without UV treatment (no UV) or treated with UV for 40 minutes. Shown from left to right: the raw spectra, the spectrum representing the difference between the two spectra, and the zoomed in view of the raw spectra in the range of 1500–1700 cm−1 (indicated with yellow lines in the other two plots). (B) Absorbance data shown for different bead treatments as indicated. The plot on the right shows the data in the 300–360 nm range to better illustrate the differences in absorbance. (C) ELISA results are shown as mean±st.dev. from at least 3 independent experiments.

