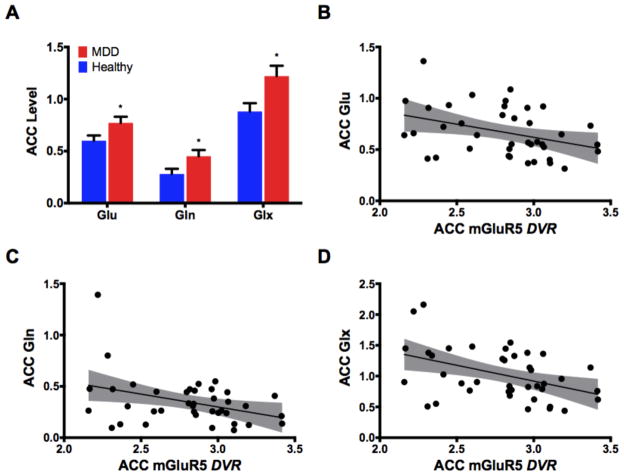
Figure 1. Glutamate level in the anterior cingulate cortex (ACC).
(A) The levels of glutamate (Glu), glutamine (Gln), and glutamate+glutamine (Glx) in the ACC of patients with MDD (red) compared to healthy (blue). (B–D) Scatter plots of the correlations between metabotropic glutamate receptor 5 (mGluR5) distribution volume ratio (DVR) in the whole group and ACC levels of glutamate (B), glutamine (C), and Glx (D). Abbreviations: (A) *, p ≤ 0.05, Bars/Error-bars: Mean/SEM; (B–D) shaded areas are the 95% confidence band of the best-fit line.

