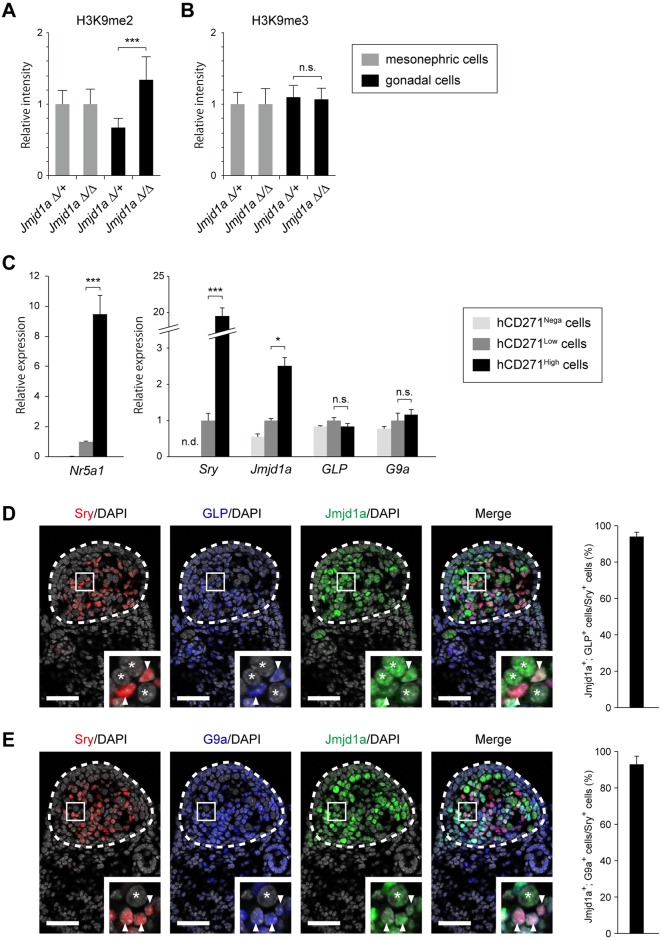
Fig 1. Expression of GLP/G9a H3K9 methyltransferase complex in XY embryonic gonads at E11.5.
(A, B) Quantitative comparison of the immunofluorescence intensities of H3K9me2 (A) and H3K9me3 (B). Representative staining profiles are shown in S1 Fig. The intensities of H3K9 methylation of Jmjd1aΔ/+ mesonephric cells were defined as 1. Data are presented as mean ± SD. *** P < 0.001; n.s., not significant. (C) Relative mRNA expression profiles of Jmjd1a, GLP, and G9a in gonadal somatic cell populations. Gonadal somatic cells were prepared from dissociated gonads from E11.5 Nr5a1-hCD271-tg embryos and fractionated according to the expression levels of hCD271 by FACS (S2 Fig). Each fraction was subjected to mRNA expression analysis by RT-qPCR. The endogenous Nr5a1 expression level was strictly correlated with the expression levels of hCD271 (left). Sry and Jmjd1a transcripts were substantially enriched in the hCD271-high population whereas GLP/G9a transcripts were detected in each population (right). mRNA expression levels in the hCD271-low population were defined as 1. Data are presented as mean ± SD. * P < 0.05, *** P < 0.001; n.s., not significant. (D, E) Triple immunofluorescence analyses for GLP (D) and G9a (E), counterstained with anti-Jmjd1a and anti-Sry in the center regions of E11.5 gonads. Enlarged boxes indicate co-expression of GLP (D) and G9a (E) with Jmjd1a in Sry-expressing pre-Sertoli cells (arrowheads). Asterisks represent germ cells. The population of the cells containing both signals of GLP (or G9a) and Jmjd1a among the Sry-expressing pre-Sertoli cells is presented at right. More than 200 cells per embryo (n = 3) were examined. Data are presented as mean ± SD. Scale bar, 50 μm.

