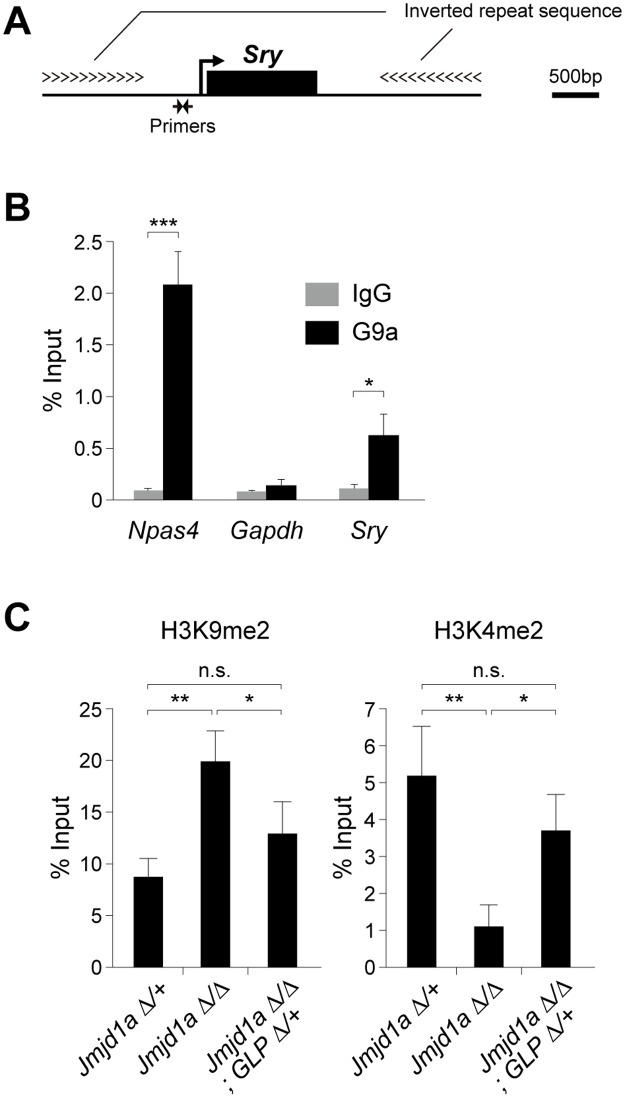
Fig 3. GLP/G9a complex catalyzes H3K9 dimethylation at the Sry locus.
(A) Diagram of the Sry locus and primer location of the linear promoter region of Sry. (B) ChIP-qPCR analysis for G9a at the linear promoter region of Sry. Gonadal somatic cells were purified from E11.5 XY Nr5a1-hCD271-tg embryos, pooled, cross-linked, and then introduced into ChIP-qPCR analysis. We used Npas4, that had been identified as one of the target loci of G9a, as a positive control locus [16]. Data are presented as mean ± SD. * P < 0.05; *** P < 0.001. (C) ChIP-qPCR analyses for H3K9me2 (left) and H3K4me2 (right) at the Sry locus. Gonadal somatic cells of the indicated genotypes were purified according to the method described in S3 Fig, pooled for each genotype (2 to 4 embryos) and then subjected to native ChIP analysis. ChIP experiment was performed independently twice and gave similar results. Data are presented as mean ± SD. * P < 0.05; ** P < 0.01; n.s., not significant.

