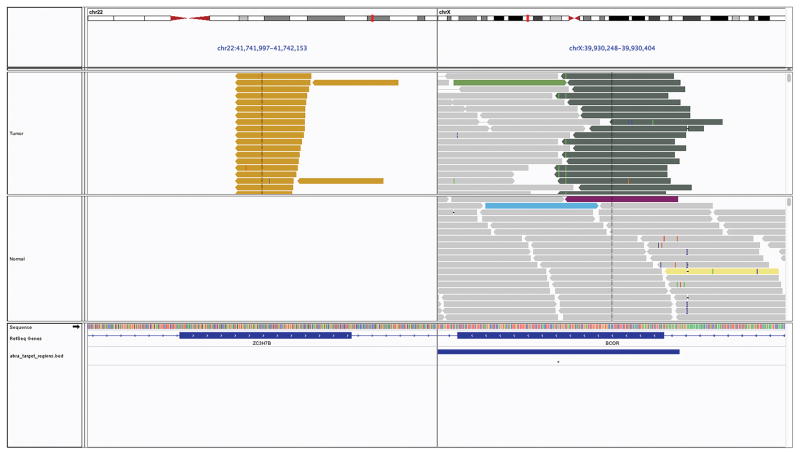
Figure 7. Pictorial representation of the ZC3H7B-BCOR translocation on Integrated Genome Viewer.
Each bar is a single sequenced read with the top panel displaying data from tumor sample and bottom panel displaying its matched normal sample. The reads are sorted to highlight read pairs with discordant read mapping on the top for each sample. As evident, one set of reads maps to ZC3H7B on chromosome 22 while the their corresponding paired end reads map to BCOR on the X chromosome, supporting the presence of a somatic fusion involving both genes.

