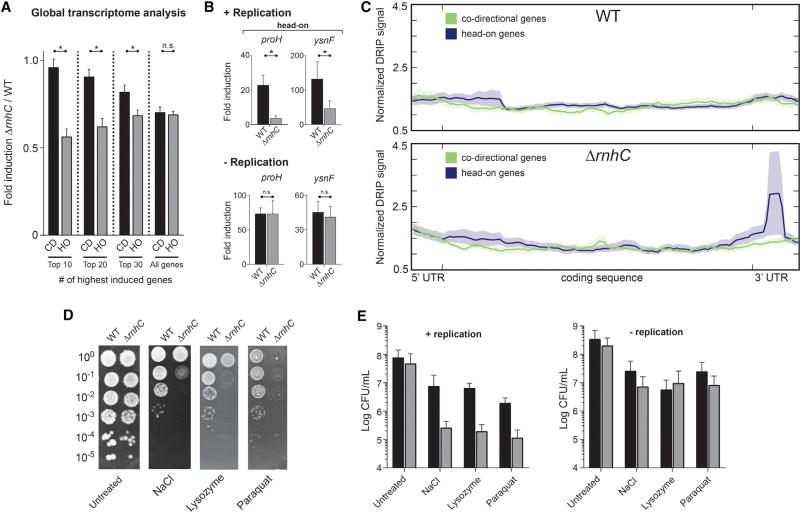
Figure 6. Resolution of R-Loops at Head-On Genes Is Required for Survival of Stress, Related to Figure S5.
(A) Global transcriptional analysis of genes upregulated during osmotic stress. CD, co-directional (black bars); HO, head-on (gray bars). Values are means and SEM. *p < 0.05.
(B) qRT-PCR analysis of head-on osmotic stress-response genes in either WT (black bars) or ΔrnhC (gray bars) cells. The y axis indicates the fold induction of the indicated gene. Values are means and SEM of at least two independent experiments.
(C) Representative plot of global analysis of DRIP-seq results in either WT or ΔrnhC cells during salt stress. Data represent the average normalized signal across all salt-response genes (including 100 bp upstream, 5′ UTR and 150 bp downstream, 3′ UTR) in each category (head-on and co-directional). Lines indicate the mean, and the shaded region indicates the standard error.
(D) Representative plates from chronic survival assays of either WT or ΔrnhC cells exposed to stressors.
(E) Quantification of WT (black bars) or ΔrnhC cells (gray bars) acutely treated with stressors. Values are the mean and SD of at least two independent experiments.

