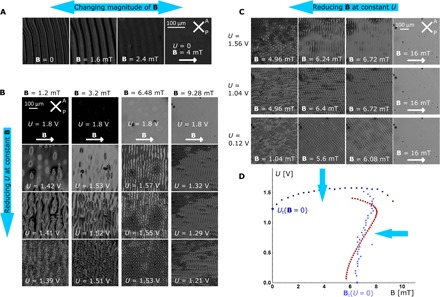
Fig. 2. POM images of structures that evolve from pTIC when either B or U is slowly reduced (0.16 mT/0.7 s and 10 mV/1.5 s).

(A) d/P = 0.94 and B is reduced. (B) d/P = 1.74 and U is reduced at constant B. (C) d/P = 1.74 and B is reduced at constant U. (D) Blue dots denote experimentally obtained values of Ut(B) and Bt(U), where the pTIC becomes unstable, and red dots denote theoretical prediction of Bt(U) obtained by stability analysis. In cases where U > 1.56 V, the direct transition from the pTIC to the fingerprint configuration was not observed; however, nucleation of cholesteric fingers was present.
