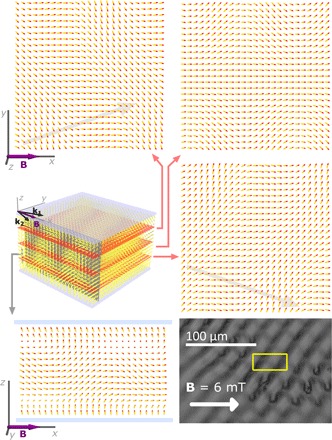
Fig. 5. Schematic of 2D periodic instability, which causes diamond pattern in the case of d/P = 1.74 and U = 0.

The structure evolves continuously from pTIC by two critical fluctuations. The maximal amplitude of the first fluctuation is located closer to the top, and that of the second fluctuation is located closer to the bottom of the layer. Schematics show the structure at the instability. Gray arrows behind the first and third schematics show the calculated wave vectors of the fluctuation, which is dominant in the corresponding region. The yellow rectangle on the POM image denotes the region that corresponds to the three in-plane cross sections.
