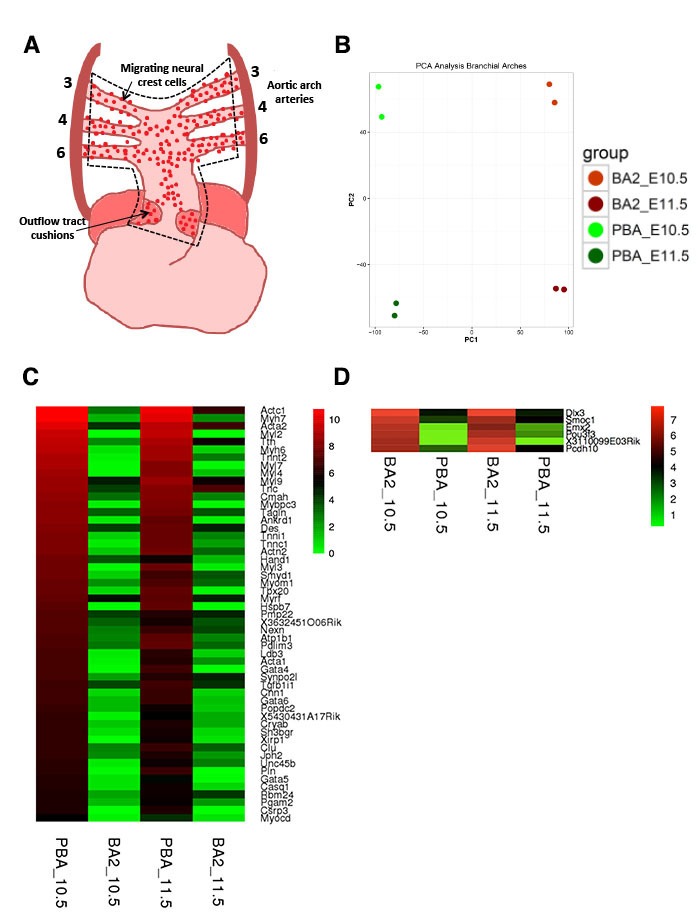
Figure 1. Global transcriptomes of developing BAs and OFT.
(A) In mammals, BA2 (red) hosts aortic arch (AA)2, which regresses, while posterior BAs (PBA, green) host AA3-6, which contribute to the main thoracic arteries. (B) Correlation plot of global expression profiling separates BA2 and PBA at E10.5 and E11.5. Heatmap shows the Spearman correlation coefficients for each pair of samples based on the normalized expression values (FPKM). (C) Count of DE genes between PBA and BA2 (fold change ≥±2; q-value <0.05) at E10.5–11.5. The bar plot shows PBA/OFT-enriched genes as the largest fraction of DE genes (color-coded as in A). (D) Hierarchical clustering of DE genes in any of the three pair-wise comparisons. DAVID analysis (Huang et al., 2009) of the clusters generated detects significant association with PBA/OFT-specific Biological Process GO terms (arrows). (E) Volcano plot. Top significant PBA/OFT-enriched genes are highly expressed in SMCs. (F) Ingenuity Pathway Analysis (IPA) identifies the TF SRF as the most likely upstream regulator of PBA/OFT-enriched genes (p-value<1e-20). SRF targets include Myocd and known Myocd targets (e.g. Acta2, Tagln).

Figure 1—figure supplement 1. Differential expression across developing BAs.