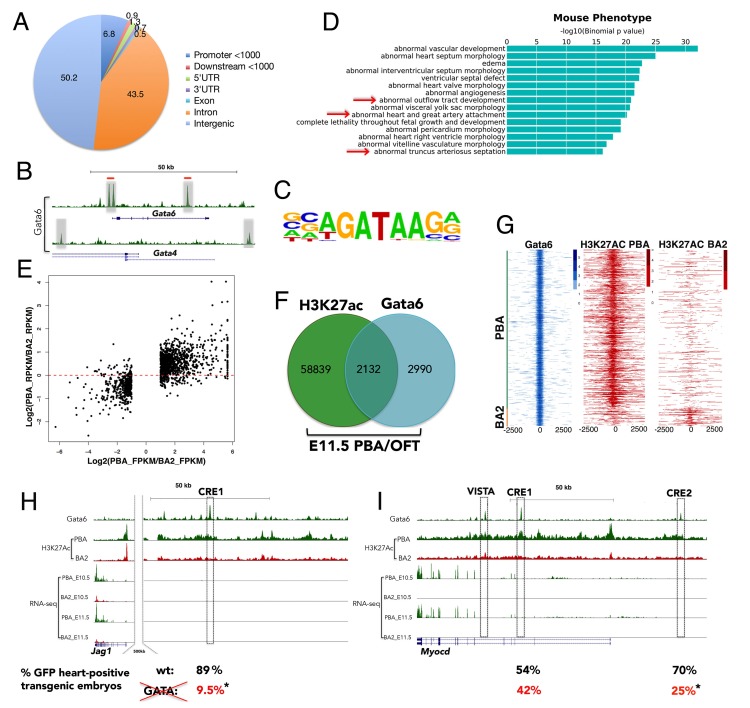
Figure 4. Gata6 occupies active enhancers in PBA/OFT.
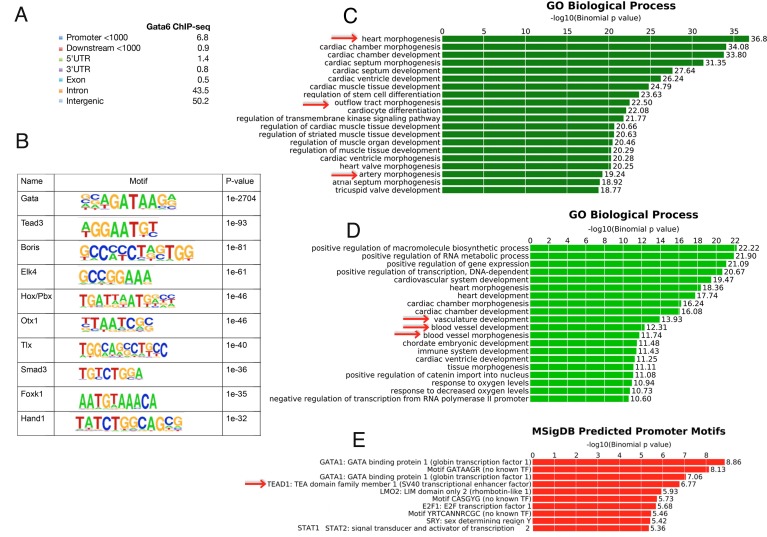
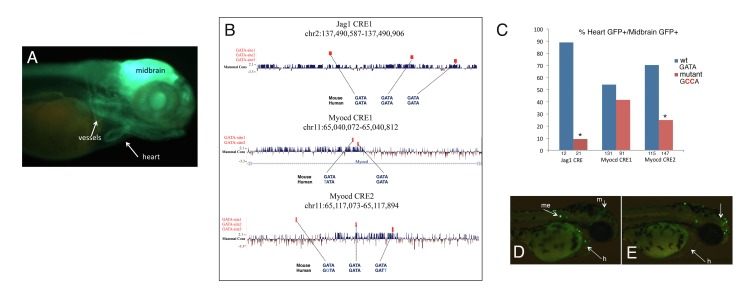
(A) CEAS analysis of the distribution of Gata6 peaks relative to Reference Sequence (RefSeq) gene structures. The pie chart and corresponding percentage values indicate the proportion of reads. (B) UCSC browser tracks shows Gata6 binding (gray regions) at Gata4 and Gata6 loci. Red lines indicate Gata4 binding in E12.5 ventricles. (C) Sequence logo of the most significant motifs identified using de novo motif discovery. (D) Top over-represented mouse phenotypes associated to Gata6 peaks. The x axes values correspond to the binomial raw (uncorrected) p-values. (E) Scatterplot of the Log2(ratio of FPKM) values for DE genes between PBA and BA2 versus the Log2(ratio of RPKM) values of their H3K27ac signals at promoters and distal regions (Correlation: 0.694; p<2.2e-16). (F) Venn diagram (not proportional) of Gata6 peaks (200nt summits) and H3K27Ac-positive regions in the PBA/OFT. Almost half of Gata6 peaks overlap regions acetylated in the PBA/OFT. (G) Heatmap of Gata6 peaks and corresponding H3K27ac peaks (within 5000 nt of the summit) shows most Gata6 peaks overlap PBA/OFT-specific enhancers (n = 820), and only a minority of BA2-specific enhancers (n = 98). Regions detected as H3K27Ac-positive in both PBA/OFT and BA2 were excluded from this analysis. (H, I) UCSC browser tracks. RNA-seq and ChIP-seq profiles for Gata6 binding and H3K27Ac in the PBA/OFT and H3K27Ac in the BA2 at Jag1 (H) and Myocd (I) loci. Gata6 binds regions highly acetylated in PBA/OFT, but not BA2 (boxed; VISTA highlights a heart-positive enhancer). Numbers correspond to the % of embryos injected with wild-type (upper row, in black) and mutant (lower row, in red) enhancers, displaying reporter activity in the heart in addition to the midbrain (positive control); asterisks denote p-value<0.05 (Fisher's Exact Test).


