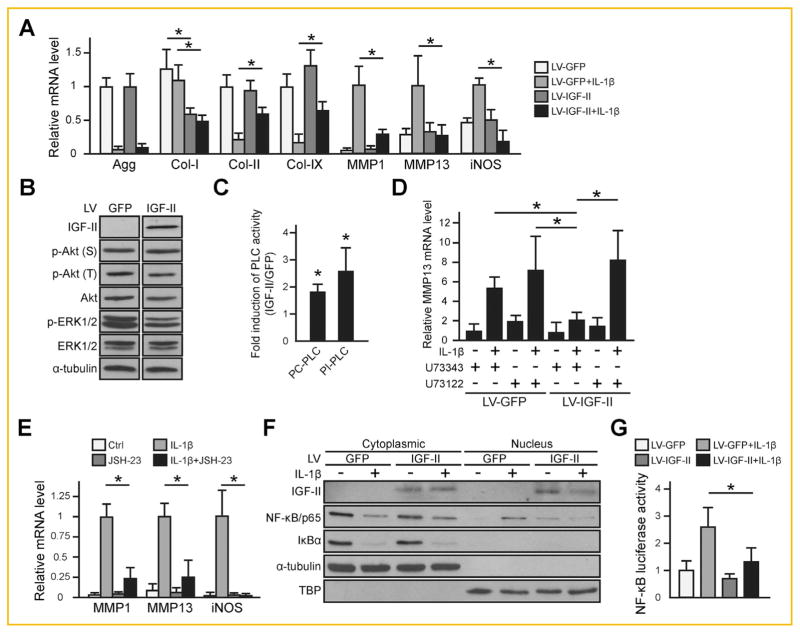
Fig. 2.
IGF-II promotes cartilage matrix expression and inhibits IL-1β-induced NF-κB/p65 activity in normal human articular chondrocytes (nHAC). For all experiments, nHAC were first infected with lentiviral IGF-II (LV-IGF-II) or GFP (LV-GFP) for 2 days before they were treated with PBS control or 1 ng/ml IL-1β. (A) RT-qPCR gene expression analysis after 4 days of IL-1β treatment. All samples treated with IL-1β exhibited significant differences as compared to their untreated counterpart in LV-GFP-treated samples. Statistical significances between LV-IGF-II and LV-GFP-treated samples were indicated by “*”. (B) Western blot analysis of phosphorylation status of Akt and ERK1/2. α-tubulin served as a loading control. (C) PLC activity assay. Two types of PLC activities were assessed: the PC-PLC activity, which releases inositol 1,4,5-trisphosphate (IP3) and 1,2-diacylglycerol (DAG); and the PI-PLC activity, which releases phosphocholine and DAG. Data were presented as fold induction of lentiviral IGF-II samples compared with the lentiviral GFP control. (D) Assessment of the effect of a pan-PLC inhibitor U73122 (1 μM) on MMP13 mRNA expression after IL-1β treatment for 4 days. As a control for U73122 (1 μM), an inactive analog U73343 (1 μM) was used. (E) RT-qPCR assessment of the effect of NF-κB inhibitor JSH-23 on IL-1β-induced MMP13 expression after IL-1β treatment for 4 days. (F) Western blot analysis of IκBα degradation and localization of NF-κB/p65 after IL-1β treatment for 1 h. Cytoplasmic and nuclear proteins were blotted for IκBα and NF-κB/p65. α-tubulin was used as a loading control for cytoplasmic proteins and TBP was used as a loading control for nuclear proteins. (G) NF-κB transactivation assay after IL-1β treatment for 16hr. Renilla luciferase activity served as an internal control. For quantification, NF-κB luciferase activity was normalized to Renilla luciferase activity. For all qPCR analysis, TBP was used as a reference gene. Data are reported as mean ± standard deviation from at least three independent experiments in triplicates. *P <0.05. LV = lentivirus.

