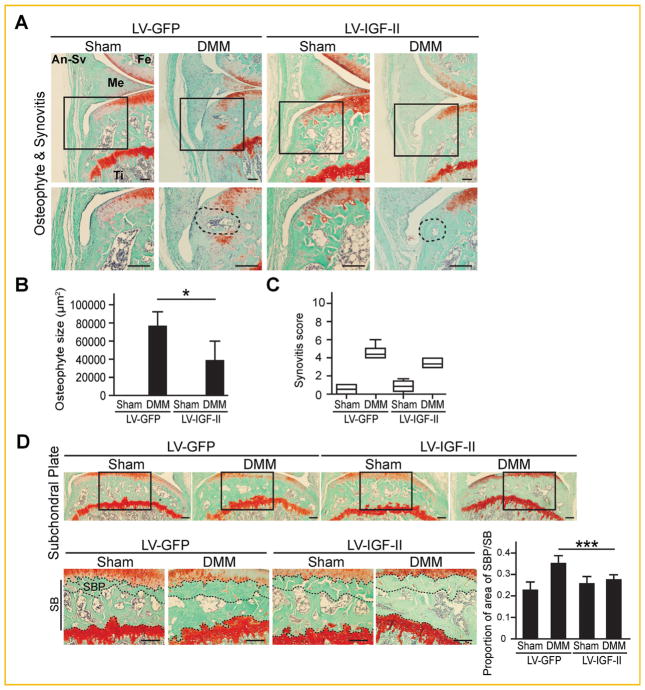
Fig. 7.
Histological analysis on osteophyte formation, synovitis and subchondral bone sclerosis of post-DMM mouse knee joints injected with lentiviral-IGF-II and lentiviral-GFP. (A) Osteophyte and synovitis images at the medial tibial plateau of the DMM knees. Rectangles denote areas shown in higher magnification. Dashed circles indicate areas of osteophytes for quantification using ImageJ. (B) Quantification of osteophyte sizes and (C) degree of synovitis. (D) Images of subchondral bone at the medial tibial plateau of the knee joints. Rectangles denote areas shown in higher magnification. Dashed lines indicate the border of subchondral bone plate (SBP) in subchondral bone (SB). Scale bar = 200 μm. Data are reported either by box-plot or as mean ± standard deviation. *P <0.05. ***P <0.001, DMM; LV-GFP versus DMM; LV-IGF-II. LV = lentivirus. Fe = femur, Ti = tibia, Me = meniscus, An-Sv = anterior synovium.

