Figure 2.

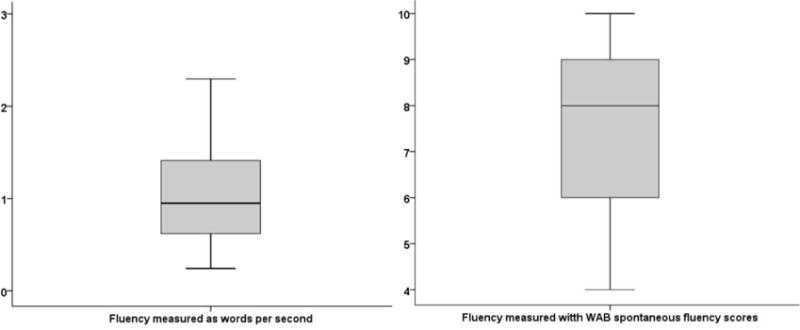
Box plots for the two measures of fluency in the participants (N = 112). The left panel shows fluency measured as words/second. Right panel shows fluency measured as WAB-R spontaneous fluency scores.

Box plots for the two measures of fluency in the participants (N = 112). The left panel shows fluency measured as words/second. Right panel shows fluency measured as WAB-R spontaneous fluency scores.