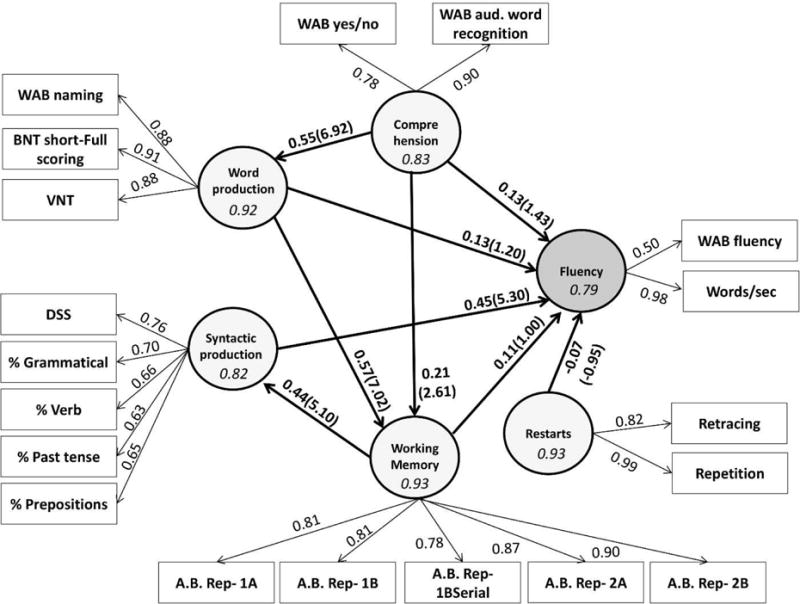
Figure 4.

Parameter estimates for the inner and outer models in the fluency pls-pm. The values on the arrows from the latent variables (circles) to manifest variables (rectangles) are factor loadings. The values on the arrows between the latent variables are path coefficients. The values inside the parentheses next to the path coefficients are their corresponding t statistics. See Table 3 for 95%CIs obtained through bootstrapping. The values inside the circles are DG rho’s.
