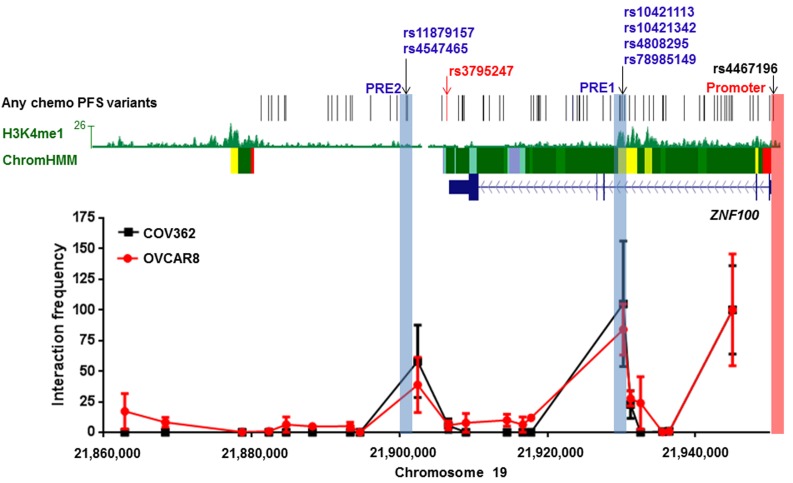
Figure 1. Two regions containing candidate all chemo PFS candidate variants interact with the ZNF100 promoter in ovarian cancer cell lines at the 19p12 outcome locus.
The figure shows 3C analyses of interactions between HindIII fragments and the ZNF100 promoter region (highlighted in pink) in COV362 and OVCAR8 cells. For each cell line, interaction frequencies were normalised to those of the fragment proximal to the promoter. Interaction frequencies from three independent biological replicates are shown (error bars represent standard error of the mean). The original variant associated with any chemotherapy PFS, rs3795247, is shown with correlated candidate outcome variants (r2 > 0.4) in black. Roadmap Consortium chromatin state segmentation for normal ovarian tissue using a Hidden Markov Model (Chrom HMM) is shown (red = active transcription start sites, dark green = weak transcription, green = strong transcription, green/yellow = genic enhancers, yellow = enhancers, aquamarine = ZNF gene repeats and turquoise = heterochromatin). H3K4Me1 modification in normal ovarian tissue is also indicated. Putative Regulatory Elements (PREs), and their coincident candidate variants, cloned into reporter gene constructs are highlighted in blue.

