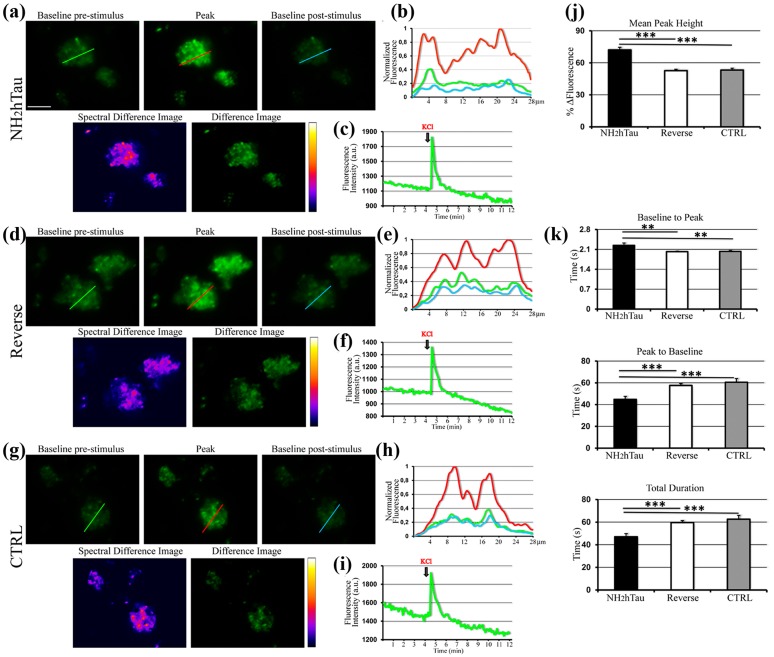
Figure 3. Acute administration of sub-toxic doses of NH2htau induces perturbation in regulation of K+-evoked intracellular calcium dynamics in isolated hippocampal synaptosomes.
Changes in K+-evoked Ca2+ levels induced by NH2htau and its reverse counterpart were assessed in Fluo-3 loaded hippocampal synaptosomes exposed to NH2htau (1µM), its reverse peptide (1µM), and saline (CTRL) 5 min before KCl (30mM) stimulation. a.-d.-g. Upper row: wide field images of treated synaptosomes. Baseline pre-stimulus is the image immediately before the fluorescence increase towards the peak. Peak is the image showing the highest fluorescence intensity. Baseline post-stimulus is the image immediately after that the post-stimulus baseline is established. Lower row: false color image (fire palette; Spectral Difference Image) showing the fluorescence intensity of the difference image. Brighter spots correspond to functional presynaptic terminals. Difference image is the subtraction of the baseline pre-stimulus image from the peak one. b.-e.-h. Normalized traces of fluorescence intensity spatial profiles derived from the line shown in a, d, and g. Green line refers to the baseline pre-stimulus image. Red line refers to the peak image. Cyan line refers to the baseline post-stimulus image. Note the relative fluorescence height intensity of the peak image (red line) which appears spatially distributed to partially fused multiple sites. c.-f.-i. Representative traces of fluorescence time courses derived from the three experimental groups. KCl black arrows indicate the time of the stimulus addition. j. Comparison, among the three experimental groups, of the average percentages of the fluorescence intensity difference between the peak and the baseline pre-stimulus values. Note the statistically significant increase of calculated value from NH2htau in comparison to those from the reverse and CTRL groups (one-way ANOVA followed by Bonferroni post-hoc test ***p<0,0001 versus NH2htau). k. kinetic analysis of the fluo-3 intensity time-course: baseline to peak, i.e. time for the rate of signal rise; peak to baseline, i.e. time for the rate of signal decay; total duration, i.e. the overall time from baseline pre-stimulus to baseline post-stimulus. Data were derived from five independent experiments. In each experiment two coverslips for each experimental group were analyzed. Values are means of at least four independent recordings and statistically significant differences were calculated by one-way ANOVA followed by Bonferroni post-hoc test (**p<0,01; ***p<0,0001 versus NH2htau). Scale bar: 20µm.

