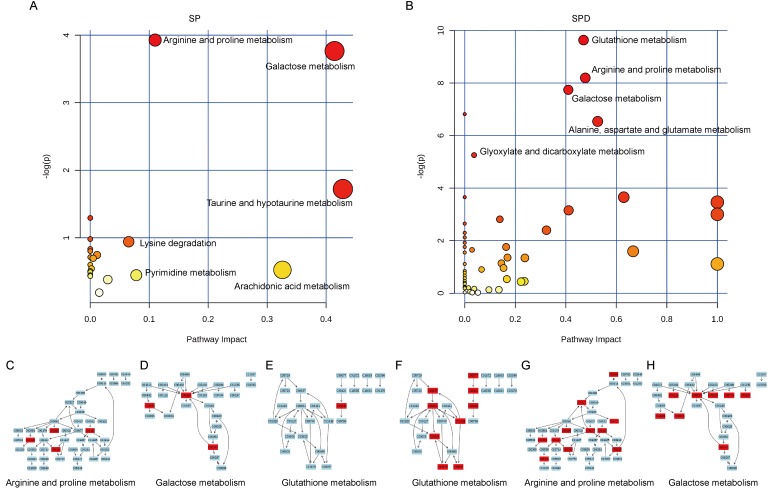
Figure 7. Pathway analysis of aged rat heart metabolites.
The most relevant pathways were analyzed using the Metaboanalyst. A Google-map style interactive visualization system was applied to facilitate data exploration and generate pathway views. Representative pathway analysis of metabolites in SP- A. or SPD-treated B. rat senescent heart tissue. SP- C., D., & E. or SPD-modulated F., G., & H. metabolites (KEGG ID) are shown in red, and are associated with arginine and proline metabolism, galactose metabolism, and glutathione metabolism pathways.

