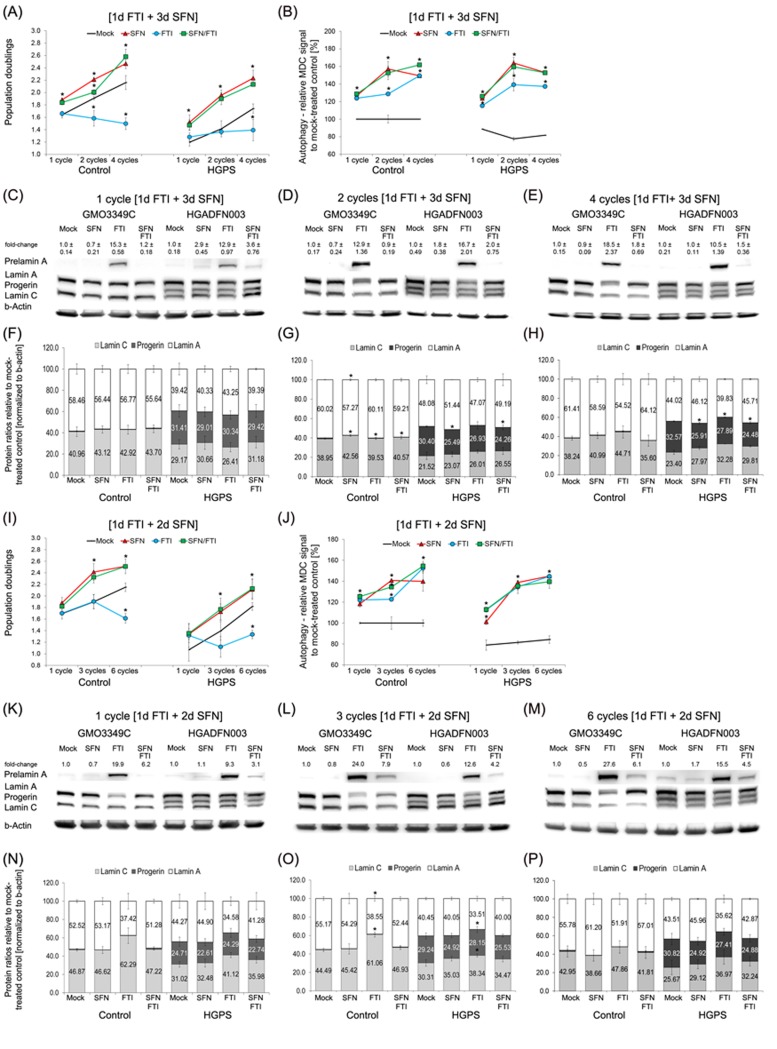
Figure 3. Intermittent treatment cycles with 1 day of FTI followed by 3 days of SFN enhance progerin clearance.
A. Population doublings were calculated as stated in Materials and Methods for control and HGPS fibroblasts after the indicated cycles. Cells were either mock-treated (vehicle, DMSO) or treated with different cycle lengths of 0.06 µM FTI for 1 day followed by 3 days of 1.0 µM SFN, as indicated. Single-drug treatment of 0.06 µM FTI and 1.0 µM SFN for the corresponding cycle times (4 days, 8 days, or 16 days) were carried out. Cells were fed daily. B. Autophagy activity of the same cells and culture conditions as in (A) was measured using monodansylcadaverine (MDC). Data are expressed as the mean ± S.D. (*p-value ≤ 0.05; n = 5). C., D., and E. Representative Western blots of A-type lamins in control and HGPS fibroblasts. Cells were treated in cycles of 1 day of 0.06 µM FTI treatment followed by 3 days of 1.0 µM SFN. The length of the cycles is indicated above each Western blot. In parallel, single-drug treatments of 0.06 µM FTI or 1.0 µM SFN for the corresponding cycle durations were performed. Blots were probed with prelamin A, lamin A/C, and b-actin antibodies (n = 4). Numbers above the prelamin A band indicate the fold-change of prelamin A relative to their mock-treated counterparts. F., G., and H. The ratios of A-type lamins were determined within each sample analyzed by Western blotting with lamin A/C antibodies (C, D, and E). Data are presented as the ratio ± S.D. (*p-value ≤ 0.05; n = 5). I. Population doublings were calculated as stated in Materials and Methods for control and HGPS fibroblasts that were either mock-treated (vehicle, DMSO) or treated with different cycle lengths of 0.06 µM FTI for 1 day followed by 2 days of 1.0 µM SFN, as indicated. Single-drug treatment of 0.06 µM FTI or 1.0 µM SFN for the corresponding cycle times (3 days, 9 days, or 18 days) was performed. Cells were fed daily. J. The same cells and culture conditions as in (I) were used to measure autophagy as described in the Methods. Data are expressed as the mean ± S.D. (*p-value ≤ 0.05; n = 5). K., L., and M. Representative Western blots of A-type lamins in control and HGPS fibroblasts. Cells were mock-treated or treated with different cycles of 1 day of 0.06 µM FTI followed by 2 days of 1.0 µM SFN, as indicated. Single-drug treatments of 0.06 µM FTI or 1.0 µM SFN for the corresponding times were performed in parallel. Blots were probed with prelamin A, lamin A/C, and b-actin antibodies (n = 4). The fold-change of prelamin A is indicated above each prelamin A band and is relative to the mock-treated counterparts. (N, O, and P) The ratios of A-type lamins were determined within each sample analyzed by Western blotting with lamin A/C antibodies N., O., and P. Levels are presented as the ratio ± S.D. (*p-value ≤ 0.05; n = 5).

