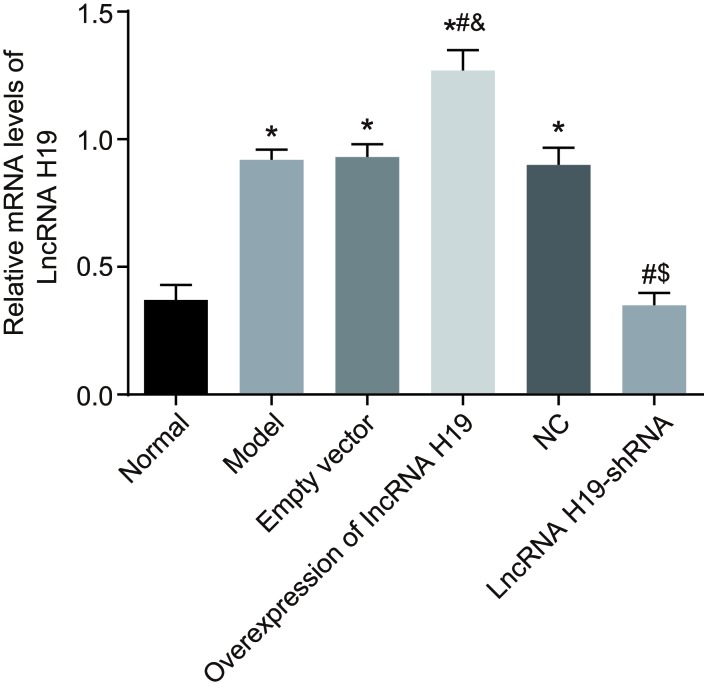
Figure 1. Expressions of Lnc RNA H19 in hippocampal tissues of rats in each group measured by qRT-PCR.
Notes: *, P < 0.05 as compared with the normal group; #, P < 0.05 as compared with the model group; &, P < 0.05 as compared with the empty vector group; $, P < 0.05 as compared to the NC group; NC = negative control; qRT-PCR = quantitative real-time plymerace chain reaction.

