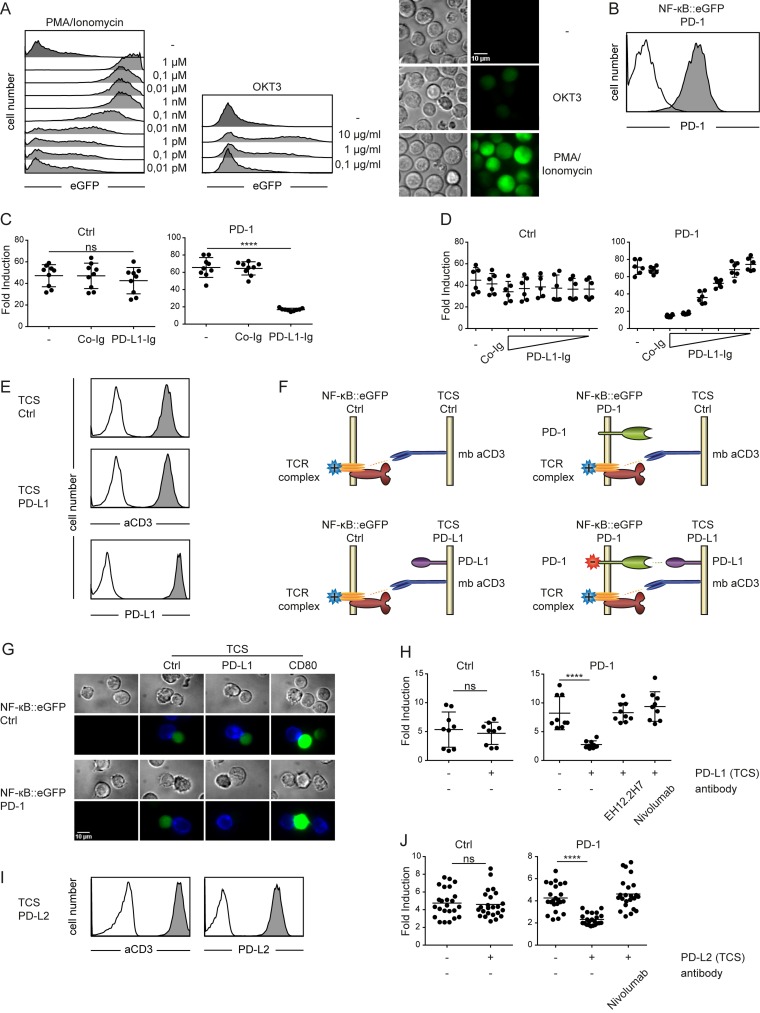
Figure 1. Use of a transcriptional reporter T cell line for the assessment of PD-1 mediated coinhibition.
A. Reporter cells were stimulated with PMA/Ionomycin (left) or cultured on plates where CD3 was immobilized in the indicated concentrations (middle) and eGFP expression was measured via flow cytometry. (Right) Shown are microscopy images of reporter cells illustrating their eGFP expression when left untreated (upper panels) stimulated with immobilized CD3 (used at 1 µg/ml, middle panels) or with PMA/Ionomycin (1 µM final concentration; lower panels). B. Control reporter cells (open histogram) and PD-1 expressing reporter cells (filled histogram) were stained with a PD-1 antibody and analyzed by flow cytometry. C. Control reporters (Ctrl) or reporters expressing PD-1 (PD-1) were stimulated for 24h with immobilized CD3 in presence of co-immobilized control fusion proteins (Co-Ig) or a PD-L1 fusion protein (PD-L1-Ig) as indicated. Results are shown from three independent experiments performed in triplicates. For statistics unpaired t-tests were performed (**** P ≤ 0.0001; ns P > 0.05). D. Control reporter (Ctrl) or reporters expressing PD-1 (PD-1) were stimulated for 24h with immobilized CD3 in presence of co-immobilized control fusion proteins (Co-Ig; 10 µg/ml) or a PD-L1 fusion protein (PD-L1-Ig immobilized at concentrations of 20, 10, 5, 2.5, 1.25 and 0.625 µg/ml) as indicated. Results shown are representative for two independent experiments performed in triplicates. E. Flow cytometry analysis of TCS. Open histograms: isotype control; filled histograms: reactivity of antibodies to the indicated molecules. F. Schematic representation of co-cultures performed in (G and H). G. Microscopy images of unstimulated control reporter cells and PD-1 expressing reporter cells and reporters stimulated with TCS-Ctrl, TCS expressing PD-L1 or CD80. TCS are stained with an APC-labelled mCD45 mAb (blue). Reporter gene expression (eGFP) is shown in green. Characterization of TCS-CD80 is shown in Figure 5A. H. Control reporter (Ctrl) and PD-1 expressing reporters (PD-1) were stimulated with either TCS or TCS expressing PD-L1, and eGFP expression was measured via flow cytometry. PD-1 mAbs (clone EH12.2H7 and Nivolumab, each used at 10 µg/ml) were added as indicated. Results shown are from three independent experiments performed in triplicates. I. Flow cytometry analysis of TCS expressing PD-L2. Open histograms: isotype control; filled histograms: reactivity of antibodies to the indicated molecules. J. Control reporter (Ctrl) and PD-1 expressing reporters (PD-1) were stimulated with either TCS or TCS expressing PD-L2, and eGFP expression was measured via flow cytometry. Nivolumab (10 µg/ml) was added as indicated. Results shown are from eight independent experiments performed in triplicates. C., D., H. and J. Reporter activation is shown as fold induction (gMFI of TCS stimulated cells/gMFI of unstimulated cells). For statistics unpaired t-tests were performed (****P ≤ 0.0001; ns P > 0.05).

