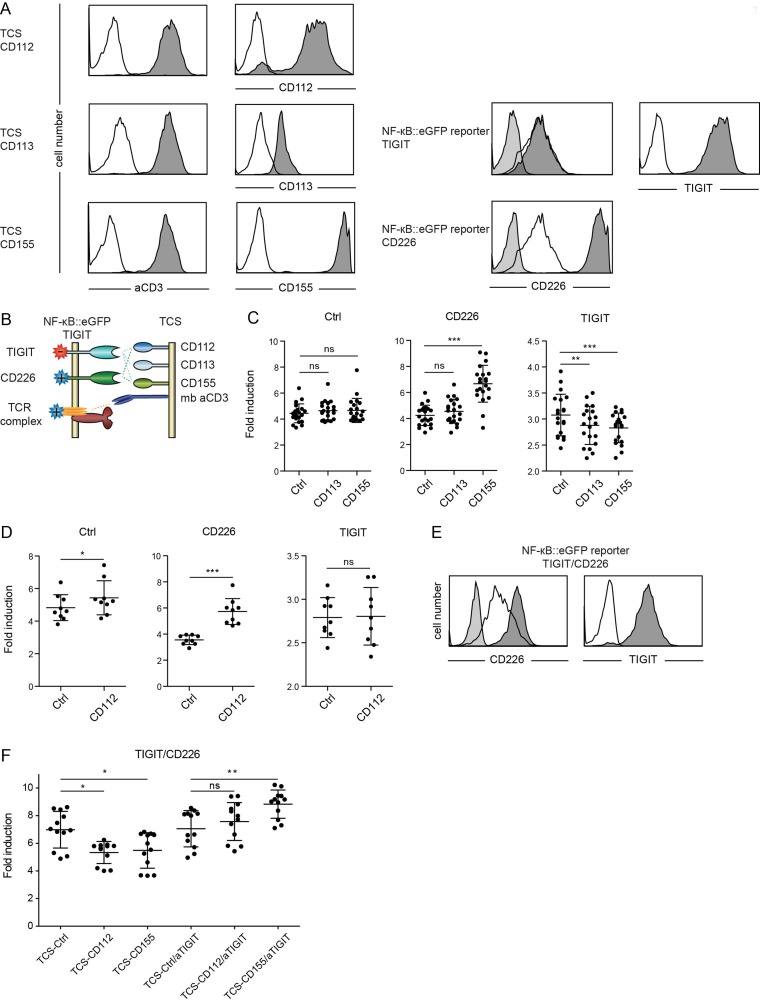
Figure 2. Evaluation of TIGIT and CD226.
A. Flow cytometry analysis of TCS and NF-κB::eGFP reporter cells. Open histograms: control cells (reporter) or isotype control (TCS); filled histograms (light grey): isotype control; filled histograms (dark grey): expression of indicated molecules on TCS or reporter cells. B. Schematic representation of receptors and ligands evaluated. C. Control reporters (Ctrl) and reporters overexpressing CD226 or TIGIT were stimulated with TCS as indicated on the x-axis, and eGFP expression was measured via flow cytometry. Results from 21 independent experiments are shown. D. Control reporters (Ctrl) and reporters overexpressing CD226 or TIGIT were stimulated with control TCS (Ctrl) or TCS expressing CD112, and eGFP expression was measured via flow cytometry. Results obtained from nine independent experiments are shown. E. Flow cytometry analysis of NF-κB::eGFP reporter cells co-expressing CD226 and TIGIT at comparable levels. Open histograms: expression of indicated molecules on control reporter cells; filled histograms (light grey): isotype control; filled histograms (dark grey): expression of indicated molecules. F. Reporter cells shown in (E) were stimulated with control TCS or TCS expressing CD112 and CD155. A blocking TIGIT mAb was used in a final concentration of 8 μg/ml as indicated. Results shown are from four independent experiments performed in triplicates. C., D. and F. Reporter activation is shown as fold induction (gMFI of TCS stimulated cells/gMFI of unstimulated cells). Each data point represents the reporter activity of an independent experiment and mean and standard deviation are also depicted. Statistics by one-way ANOVA, followed by Tukey’s multiple comparison post test (* P ≤ 0.05; ** P ≤ 0.01; *** P ≤ 0.001; ns P > 0.05).

