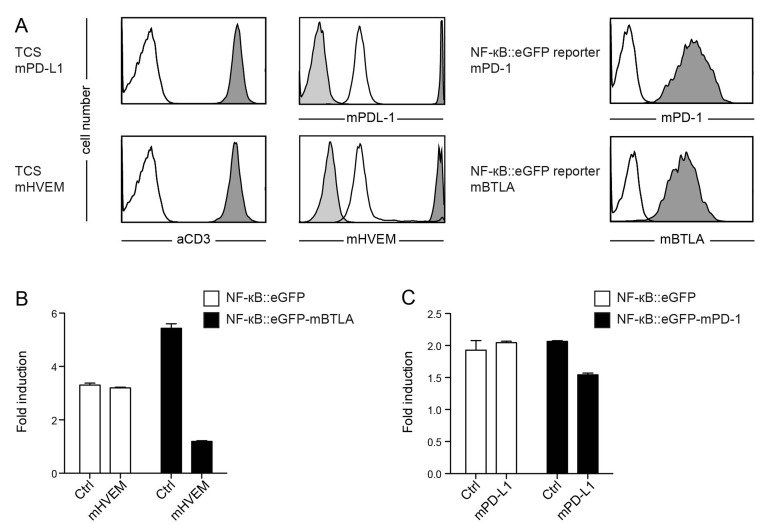
Figure 4. Evaluation of reporter cells expressing murine BTLA or murine PD-1.
A. Flow cytometry analysis of TCS and NF-κB::eGFP reporter cells. Open histograms: control cells; filled histograms (light grey): isotype control; filled histograms (dark grey): expression of indicated molecules on TCS or reporter cells. B. Control reporter cells (Ctrl) and reporter cells expressing mBTLA were stimulated with control TCS or TCS overexpressing murine HVEM as indicated on the x-axis, and eGFP expression was measured via flow cytometry. C. Control reporter cells (Ctrl) and reporters cells expressing mPD-1 were stimulated with control TCS or TCS overexpressing murine PD-L1 as indicated on the x-axis, and eGFP expression was measured via flow cytometry. B.+ C. Mean and standard deviation from duplicates is shown. Reporter activation is shown as fold-induction (gMFI of TCS stimulated cells/gMFI of unstimulated cells). Experiments are representative for four independently performed experiments.

