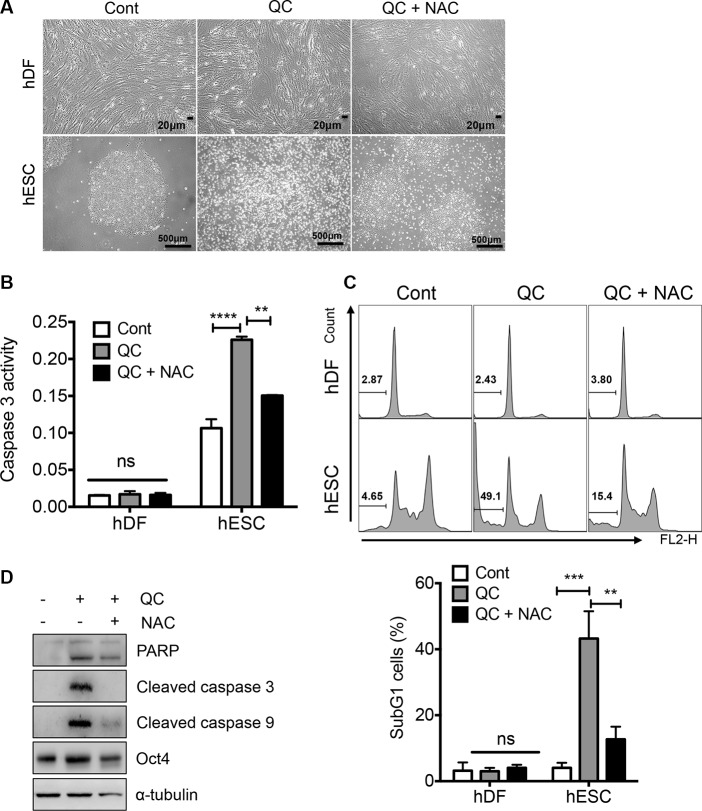
Figure 2. ROS is responsible for QC induced cell death in hESCs.
(A) 1 mM of NAC was pretreated 2 hours prior to 50 μM of QC treatment. Light microscopic images for hDFs (upper panels) and hESCs (lower panels) were shown [scale bar = 20 µm (top) or 500 µm(bottom)]o. (B) Relative level of caspase-3 activity of hDFs and hESCs after QC treatment was shown in a bar graph (n = 3). (C) Flow cytometry plots for sub-G1 population of hDF or hESCs 16 hours after 50 μM of QC treatment in the presence or absence of 1mM of NAC were shown (top panels). Sub-G1 population was represented by a bar graph (bottom panel). (D) Immunoblotting analysis for indicated protein level was shown. α-tubulin was used for equal loading control.

