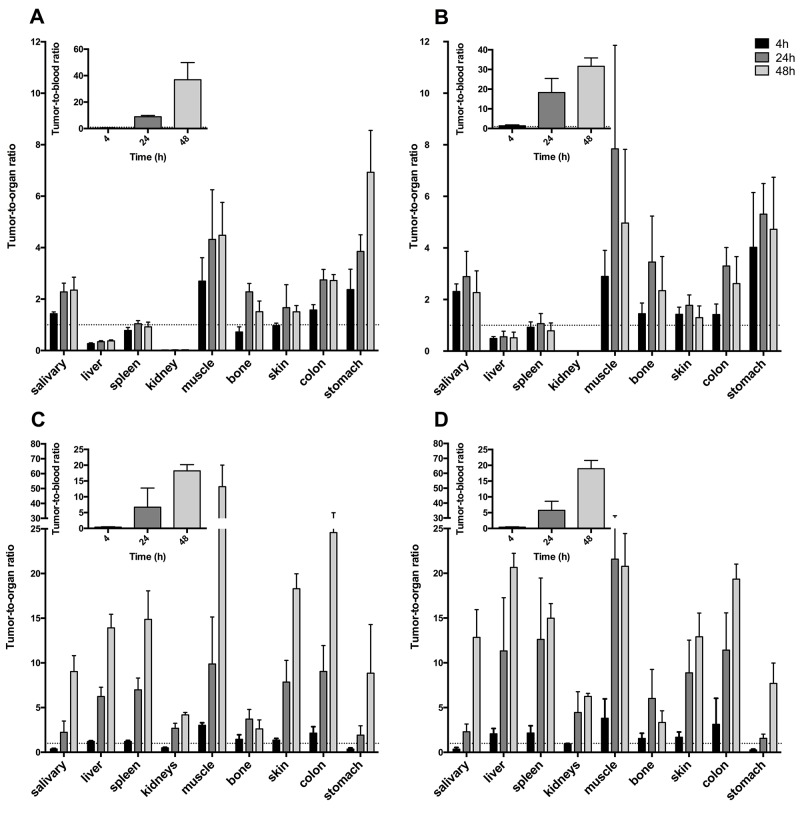
Figure 5. A431 tumor-to-organ ratios for selected organs.
Inset: Tumor-to-blood ratios. Error bars show standard deviation (N=4). (A) Tumor-to-organ ratios for 111In-DTPA-A11. (B) Tumor-to-organ ratios for 111In-DTPA-H12. (C) Tumor-to-organ ratios for 125I-A11(Iodogen). (D) Tumor-to-organ ratios for 125I-H12(Iodogen).

