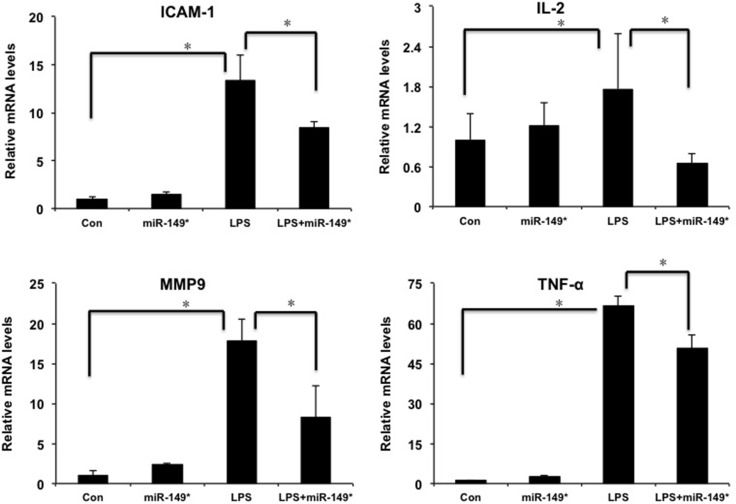
Figure 4. miR-149* suppressed inflammatory gene expression induced by LPS in mouse liver.
QRT-PCR analysis of the expression of proinflammatory genes in mouse liver. WT mice were injected in the tail vein with miR-149* agomir or negative control agomir. Two day later, mice were treated with LPS (20 mg/Kg body weight) for 6 hours. Then the mouse livers were collected for qRT-PCR analysis. (n = 4–5) *p < 0.05. Con, negative control agomir-treated group; miR-149*, miR-149* agomir-treated group; LPS, negative control agomir+LPS-treated group; LPS+miR-149*, LPS+miR-149* agomir-treated group.

