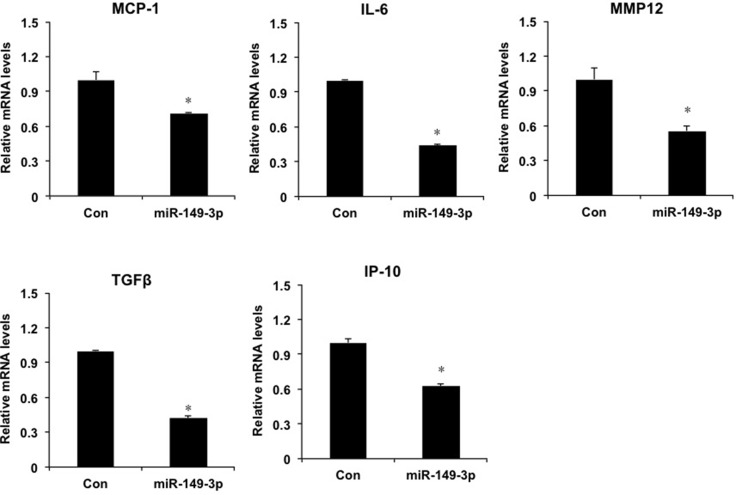
Figure 5. miR-149* regulates liver cell inflammatory response in HepG2 cells.
QRT-PCR analysis of the expression of proinflammatory genes in HepG2 cells. Cells were transfected with miR-149* mimics (25 nM) or negative control mimics. Twenty-four hours, cells were collected and RNA was extracted for qRT-PCR analysis. (n = 3) P < 0.05 versus the control groups. Con, negative control mimics; miR-149-3p, miR-149* mimics.

