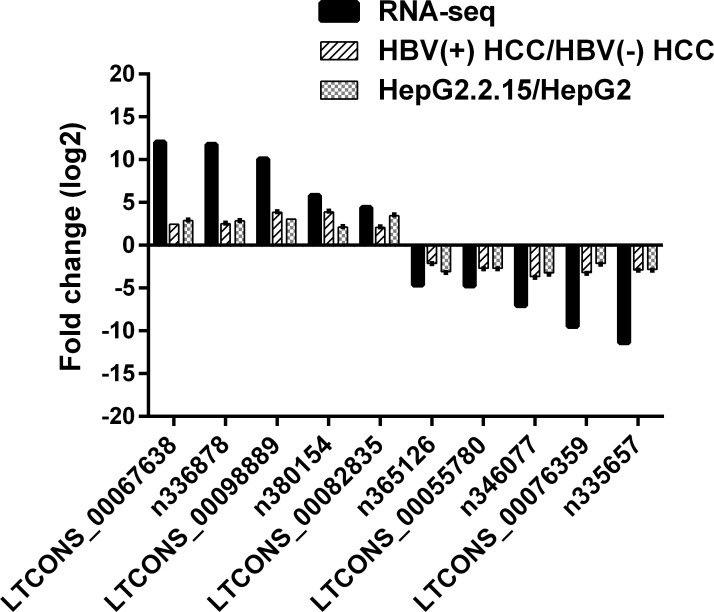
Figure 4. Validation for the expression of 10 randomly selected lncRNAs using RT-qPCR.
RT-qPCR analysis of RNA extracted from 10 HBV (+) HCC patients and 3 HBV (–) HCC patients or HepG2.2.15 and HepG2 cells. β-Actin was used as an internal control. Each sample was analyzed in triplicate. The heights of column represent mean fold changes (log2 transformed) compared with control groups.

