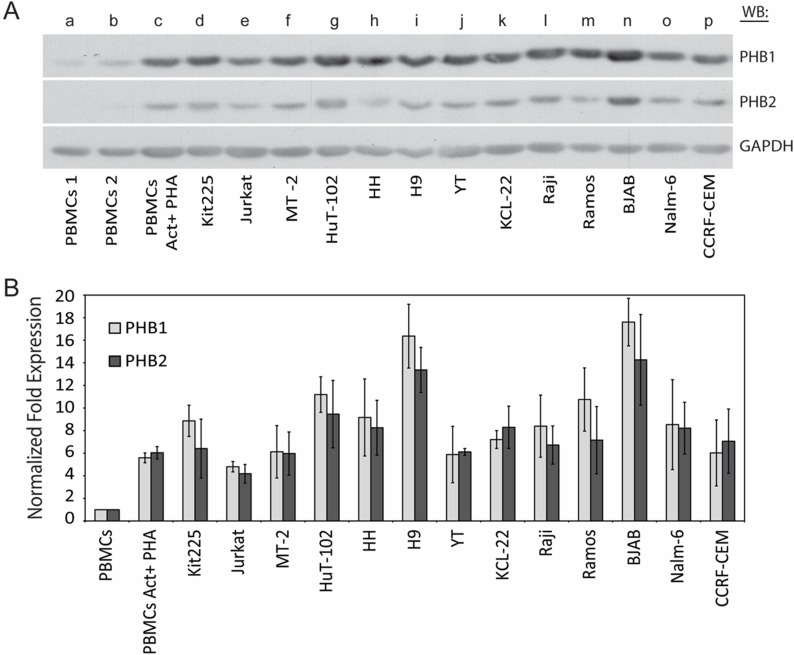
Figure 1. PHB1 and PHB2 protein expression in human lymphoid and myeloid derived tumor cell lines.
(A) Naïve (lane a and b) or PHA activated primary human PBMCs (lane c), CLL T cell line Kit225 (lane d), ALL T cell line Jurkat (lane e), HTLV-1 transformed T cell lines MT-2 and Hut102 (lane f and g), CTCL cell lines HH and H9 (lane h and i), NK-like lymphoma cell line YT (lane j), CML cell line KCL-22 (lane k), Burkitt’s lymphoma cell lines Raji, Ramos and BJAB (lane l, m and n), pre-B-ALL cell line NALM-6 (lane o), and ALL cell line CCRF-CEM (lane p) cell lysates (10 µg) were separated by 10% SDS-PAGE and subjected to Western blot analysis with antibodies directed to PHB1, PHB2 or GAPDH. (B) PHB1 and PHB2 band intensities were normalized to GAPDH using densitometric analysis and the fold increase plotted for each cell type. Values represent the mean ± S.D. of three independent experiments.

