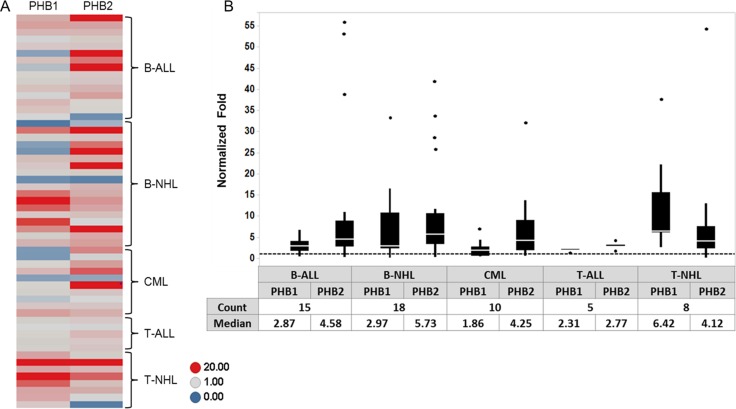
Figure 5. PHB1/PHB2 are overexpressed in tumor cells obtained from individuals diagnosed with lymphoid or myeloid malignancies.
PBMCs were isolated from normal donors (n = 5) and patients diagnosed with B-ALL (n = 15), B-NHL (n = 18), CML (n = 10), T-ALL (n = 5) and T-NHL (n = 8). Cell lysates (10 µg) were separated by 10% SDS-PAGE and subjected to Western blot analysis with antibodies directed to PHB1, PHB2 and GAPDH. (A) PHB1 and PHB2 band intensities were normalized to GAPDH using densitometric analysis and fold increase relative to the average expression in the normal PBMC donors plotted for each sample as a heat map. (B) Box plot depicting the relative fold expression of PHB1 and PHB2 across the different tumor cell types with the median fold increase denoted in the table (dots represent outlier values).

