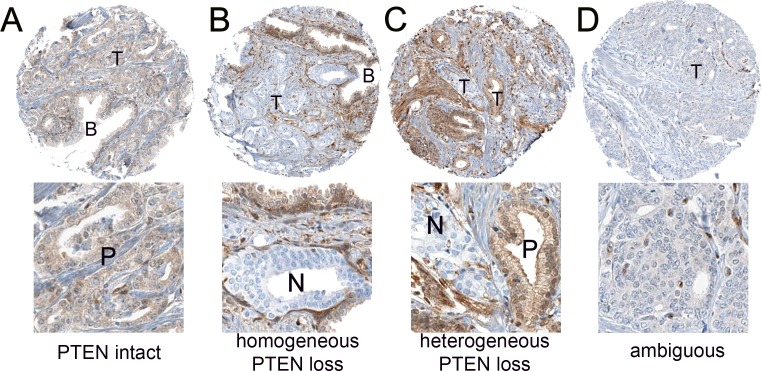
Figure 1. Representative PTEN immunohistochemistry results.
(A) PTEN intact in tumor cells (T), with equivalent staining in nearby benign glands (B). Higher magnification inset below shows positive (P) staining tumor glands. (B) PTEN homogeneous loss in tumor glands (T), with intact staining in nearby benign glands (B) and stroma. Higher magnification inset below shows negative (N) staining tumor glands. (C) PTEN heterogeneous loss, with staining loss in some but not all sampled tumor cells (T). Higher magnification inset below shows positive (P) staining and negative (N) staining tumor glands. (D) PTEN ambiguous staining. PTEN is decreased but not lost in tumor glands and absence of background benign glands for comparison makes this case difficult to interpret. Higher magnification inset below shows glands with ambiguous PTEN immunostaining.

