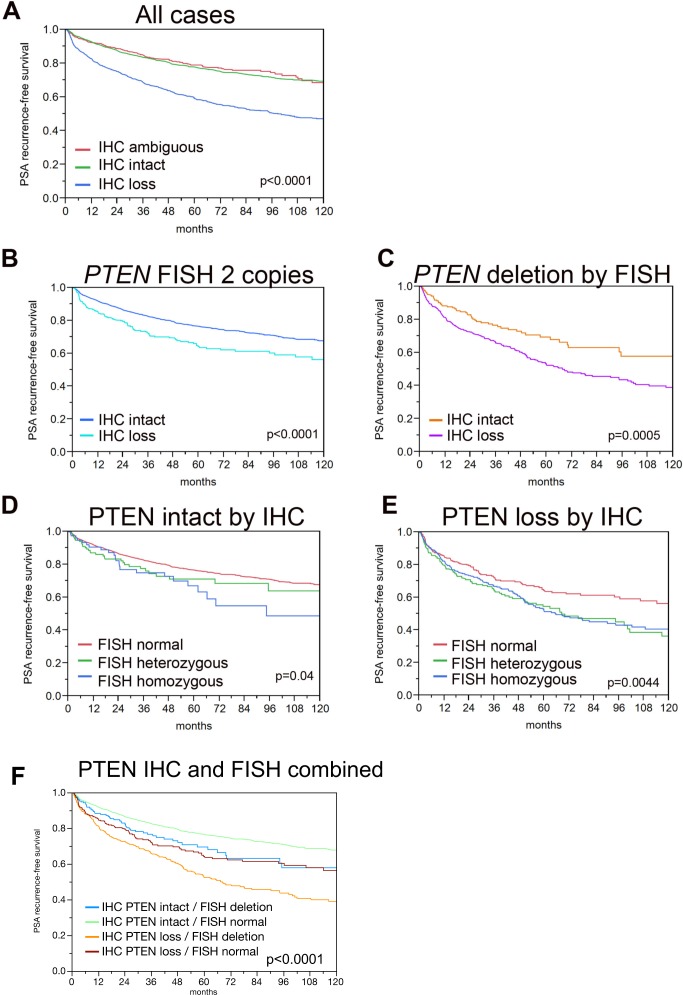
Figure 2. Kaplan-Meier analysis for PSA recurrence-free survival by PTEN IHC and FISH status.
(A) All cases with PTEN IHC and FISH results, stratified by PTEN IHC intact (n=2,970, ncensored=2,372) and PTEN IHC loss (n=992, ncensored=615). (B) All cases with normal PTEN FISH results, stratified by PTEN IHC intact (n=2,756 ncensored=2214) and PTEN IHC loss (n=332, ncensored=229). (C) All cases with PTEN deletion by FISH stratified by PTEN IHC intact (n=214, ncensored=158) and PTEN IHC loss (n=660, ncensored=386). (D) All cases with PTEN intact by IHC, stratified by PTEN FISH normal (n=2,756, ncensored=2,214), PTEN FISH heterozygous deletion (n=137, ncensored=104) and PTEN FISH homozygous deletion (n=77, ncensored=54). For comparison between PTEN normal and PTEN heterozygous deletion, p=0.1016. For comparison between PTEN normal and PTEN homozygous deletion, p=0.0393. For comparison between PTEN homozygous deletion and PTEN heterozygous deletion, p=0.5776. (E) All cases with PTEN loss by IHC, stratified by PTEN FISH heterozygous deletion (n=248 ncensored=144) and PTEN FISH homozygous deletion (n=412, ncensored=242). For comparison between PTEN normal and PTEN heterozygous deletion, p=0.0017. For comparison between PTEN normal and PTEN homozygous deletion, p=0.0044. For comparison between PTEN homozygous deletion and PTEN heterozygous deletion, p=0.4777.

