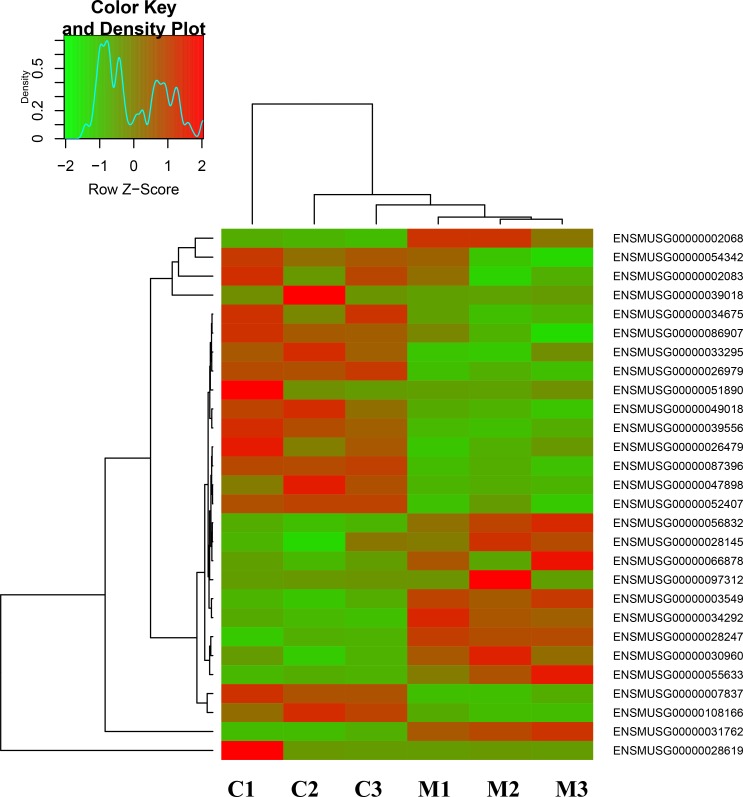
Figure 2. The distinct expression patterns of transcriptome in melatonin-regulated GC-1 spg cells.
Hierarchical clustering of transcriptome that showed the different gene expression profiles in GC-1 spg cells after melatonin treatment. Expression levels are defined by the color key on the top-left side of the figure. C indicates control, M indicates melatonin treatment.

