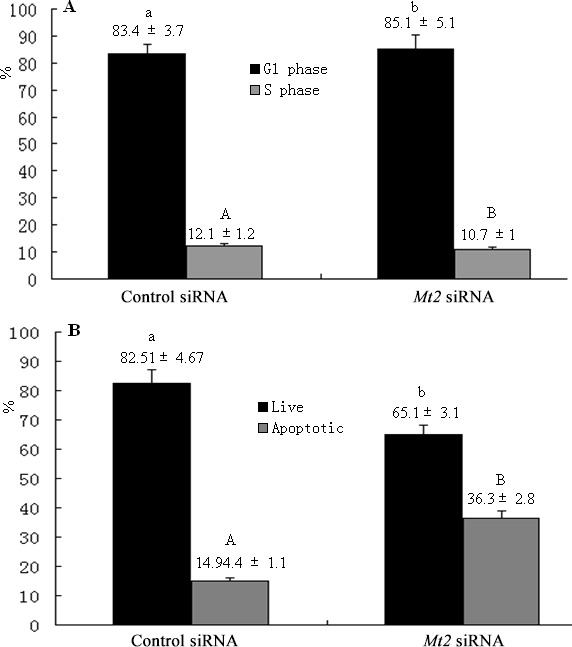
Figure 9. The cell cycle and apoptosis after Mt2 knockdown in GC-1 spg cells.

The percentage of cells in the G1 phase was increased, and the percentage of cells in the S phase was decreased with Mt2 siRNA (A). Meanwhile, the percentage of apoptotic cells was increased after Mt2 knockdown in cells (B). Different letters indicate significant differences (p < 0.05).
