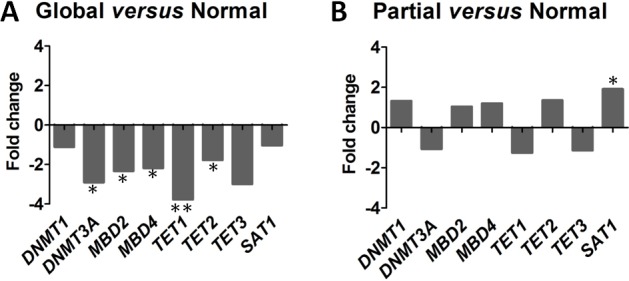
Figure 4. Distinct epigenetic regulator profiles according to the 3 cytosine derivative subgroups.

Epigenetic regulators are tested by real time PCR and expressed relative to GAPDH: the DNA methylation ‘writers’, DNMT1/3A; ‘readers’, MBD2/4; ‘editors’, TET1/2/3; and the ‘modulator’ SAT1. (A) Fold changes of epigenetic regulators between the chronic lymphocytic leukemia (CLL) global subgroup (n = 9) compared to the CLL normal subgroup (n = 13). (B) Fold changes of epigenetic regulators between the CLL Partial subgroup (n = 11) compared to the CLL Normal subgroup. Statistical differences between Global and Partial subgroups versus Normal subgroup were assessed using the non-parametric Mann-Whitney test and P < 0.05 are indicated as follows: (***) P < 0.001; (**) 0.001 < P < 0.01; (*) 0.01 < P < 0.05.
