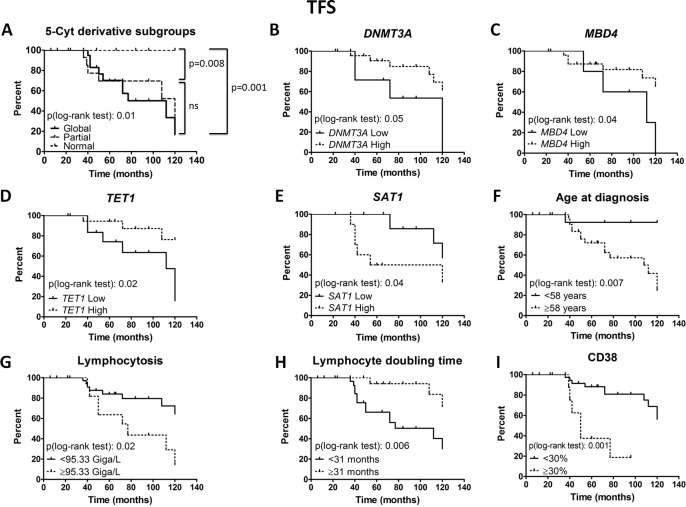
Figure 6. Prognostic power of epigenetic subgroups and regulators.
Treatment free survival (TFS) Kaplan-Meier curves are depicted for the 3 cytosine derivative subgroups (A), DNMT3A (B), MBD4 (C), TET1 (D), SAT1 (E), age at diagnosis (F), lymphocytosis (G), lymphocyte doubling time from diagnosis (H) and CD38 (I). Epigenetic regulator expression patterns were measured by real time PCR and normalized to GAPDH. The Cox regression model of TFS was used to identify the optimal cut-off level in order to dichotomize CLL patients into high versus low levels, except for CD38. Statistical differences between the curves were calculated using the log-rank test.

