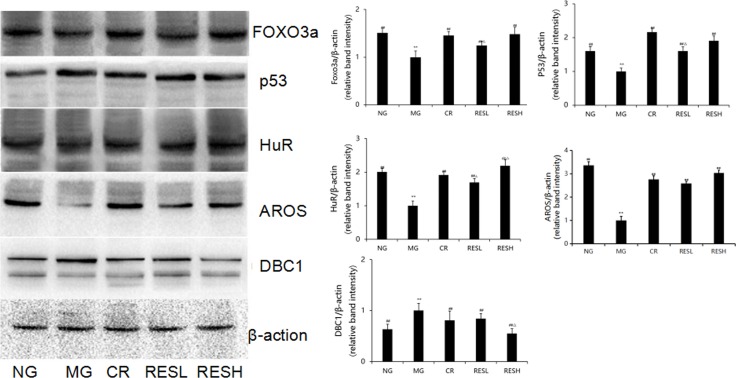
Figure 10. Effect of resveratrol and caloric restriction on protein expressions of p53, FOXO3a, HuR, AROS and DBC1 in brains of aging rats.
All values were expressed as means ± SD. *P < 0.05, **P < 0.01 compared with negative control group; #P < 0.05, ##P < 0.01 compared with model negative group; ∆P < 0.05 compared with CR group (RES group). NG, negative control group; MG, model control group; RESL, low dose of resveratrol group; RESH, high dose of resveratrol group; CR, caloric restriction group.

