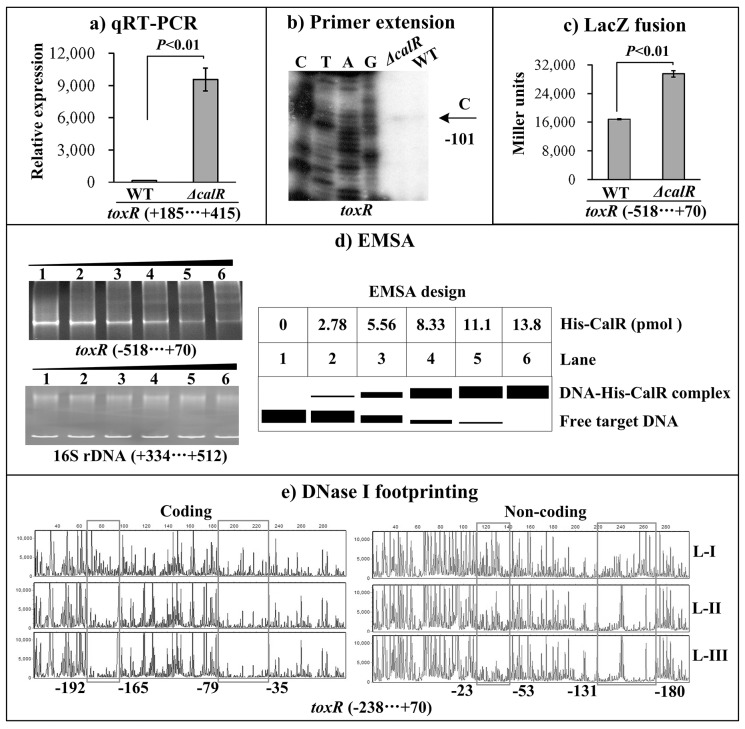
Figure 3. CalR represses the transcription of toxR.
The negative and positive numbers represent the nucleotide position upstream and downstream of toxR, respectively. (A) qRT-PCR, (B) primer extension, and (C) LacZ fusion were done as Figure 2. (D) EMSA. The promoter DNA region of toxR was incubated with increasing amounts of purified His-CalR, and then subjected to 6% (w/v) polyacrylamide gel electrophoresis. The DNA bands were visualized by EB staining. Shown below the EMSA results is the EMSA design. (E) DNase I footprinting. The promoter fragment of toxR was labelled with FAM or HEX, incubated with increasing amounts of purified His-CalR (Lanes-I, II, and III containing 0, 5.52, and 11.04 pmol, respectively), and then subjected to DNase I footprinting assay. The fragments length was analyzed using an ABI 3500XL DNA analyzer. The footprint regions were boxed and marked with positions.

