
Figure 7.
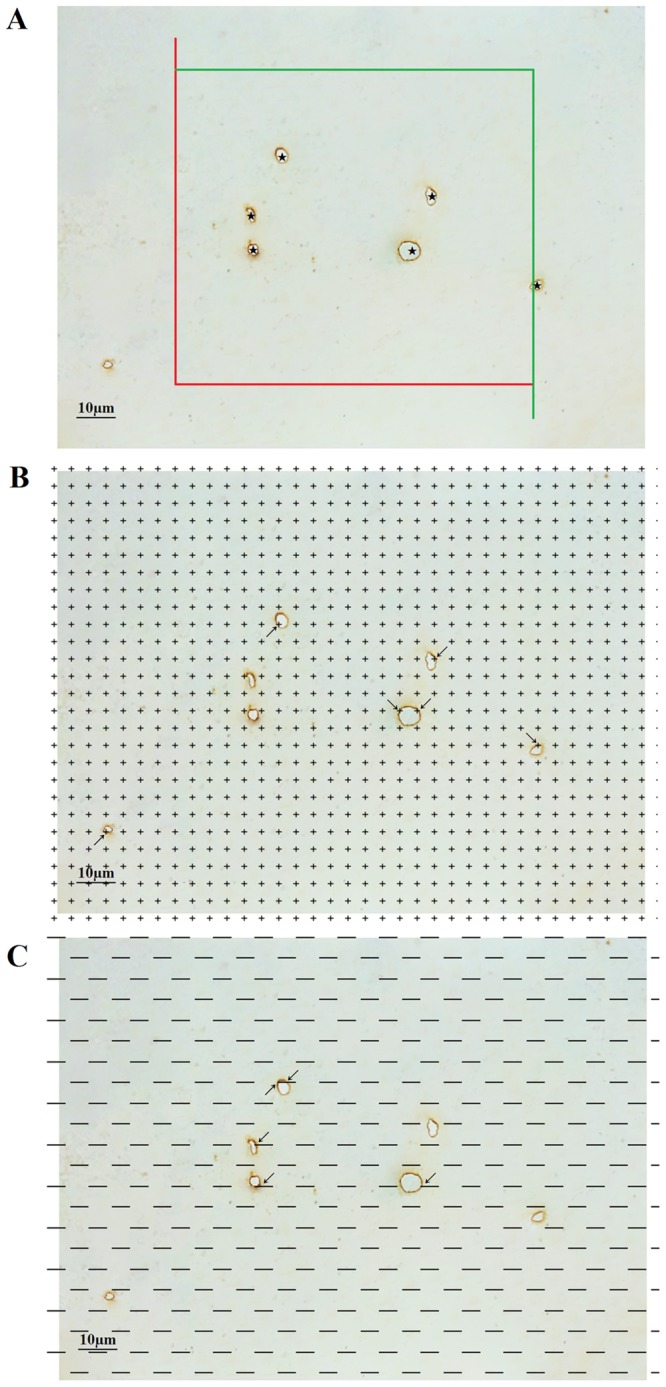
(A) An unbiased counting frame was randomly placed on the view of the white matter, and the capillary profiles inside the counting frame were counted, including those crossing the inclusion lines (green lines) but not crossing the exclusion lines (red lines). The stars (★) indicate counted capillaries. Bar = 10 μm. (B) A point grid was randomly placed on the view of the white matter, and the number of points contacting white matter and the number of points contacting capillaries were counted. The arrows (→) indicate the counted points. Bar = 10 μm. (C) Test lines were superimposed on the view of the white matter, and the number of intersections between the test lines and the capillary luminal surfaces was counted. The arrows (← & →) indicate the counted intersections between the test lines and the capillaries. Bar = 10 μm.