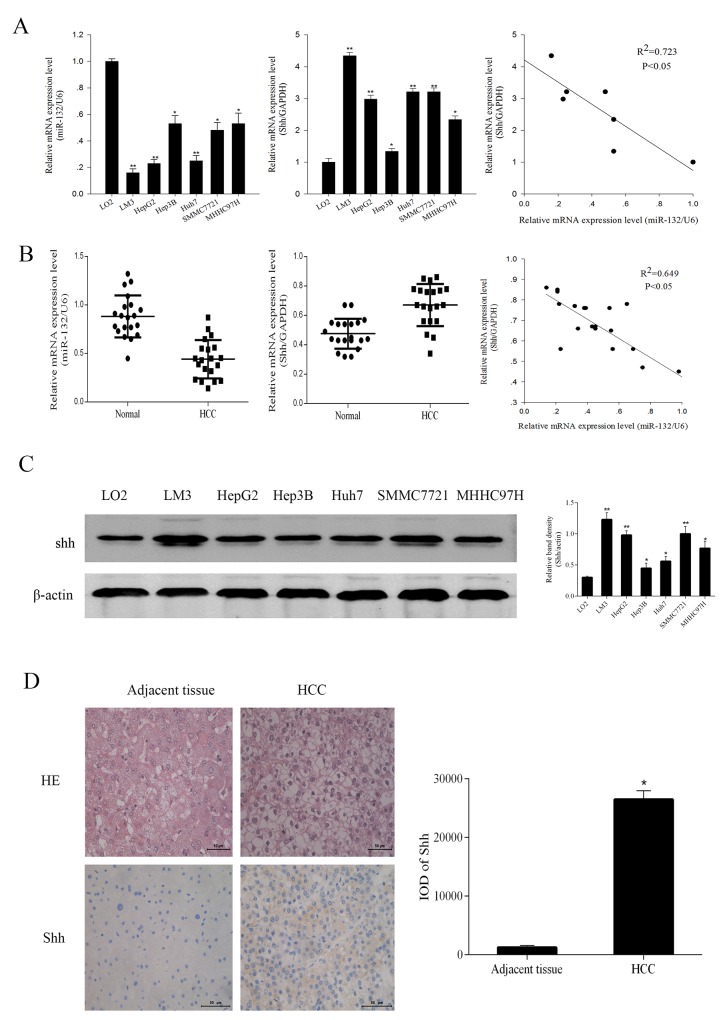
Figure 1. The expression of miR-132 and Shh in HCC cells and tissues.
(A, B) The relative mRNA expression of miR-132 and Shh in HCC cells and tissues was detected by qRT-PCR. Statistical analysis of the correlations between the expression of miR-132 and Shh was performed using Spearman correlation analysis in SPSS 20.0 software (R2 = 0.723 for cells and R2 = 0.649 for tissues). (C) The protein expression of Shh was measured by western blotting. β-actin was used as an internal control (n = 3, *P < 0.05 and **P < 0.01 for HCC cells vs. LO2). (D) Hematoxylin-eosin staining of HCC samples and adjacent tissues and immunoreactivity to Shh as observed by fluorescence microscopy (magnification ×400). Integrated optical density (IOD) was analyzed using Image-Pro Plus 6.0 (n = 6, **P < 0.05 for HCC vs. adjacent tissues).

