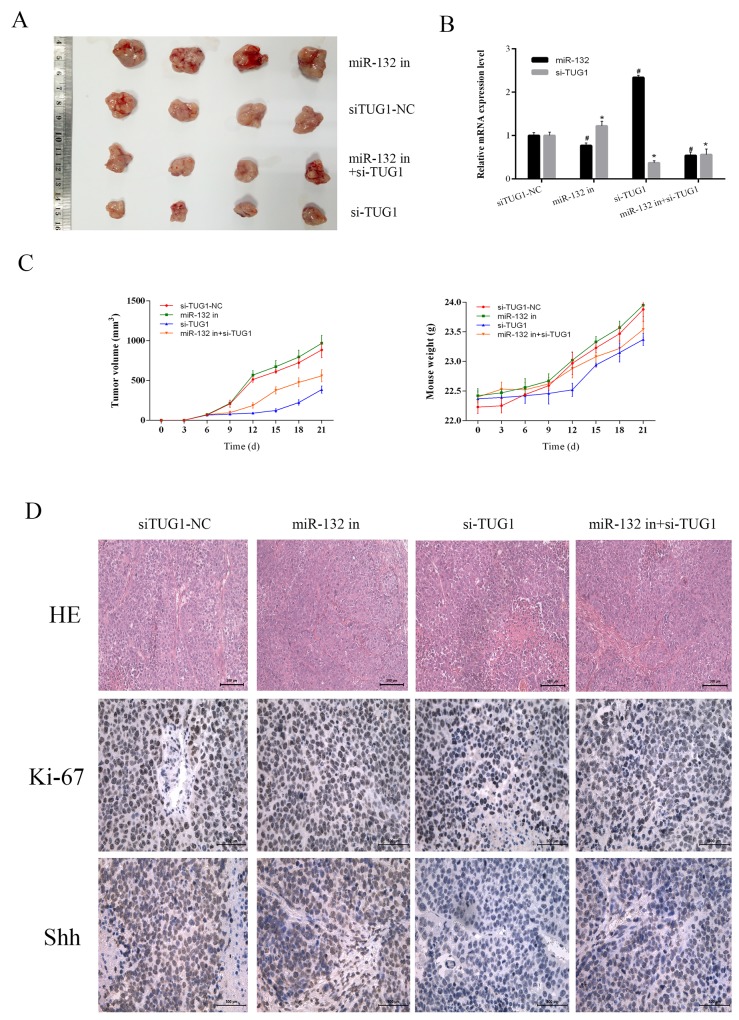
Figure 6. The effect of TUG1 on tumor growth in vivo.
(A) Gross observation of HCC-LM3 cell xenograft tumors in nude mice. (B) The expression of miR-132 and TUG1 were measured by qRT-PCR (n = 3, *#p < 0.05 for miR-132 in, si-TUG1, miR132 in+si-TUG1 vs. siTUG1-NC). (C) Changes in tumor volume and body weight were recorded at the time points indicated. (D) HE (magnification ×200) and immunohistochemical staining (magnification ×400) of tumors show the levels of Shh and Ki-67.

