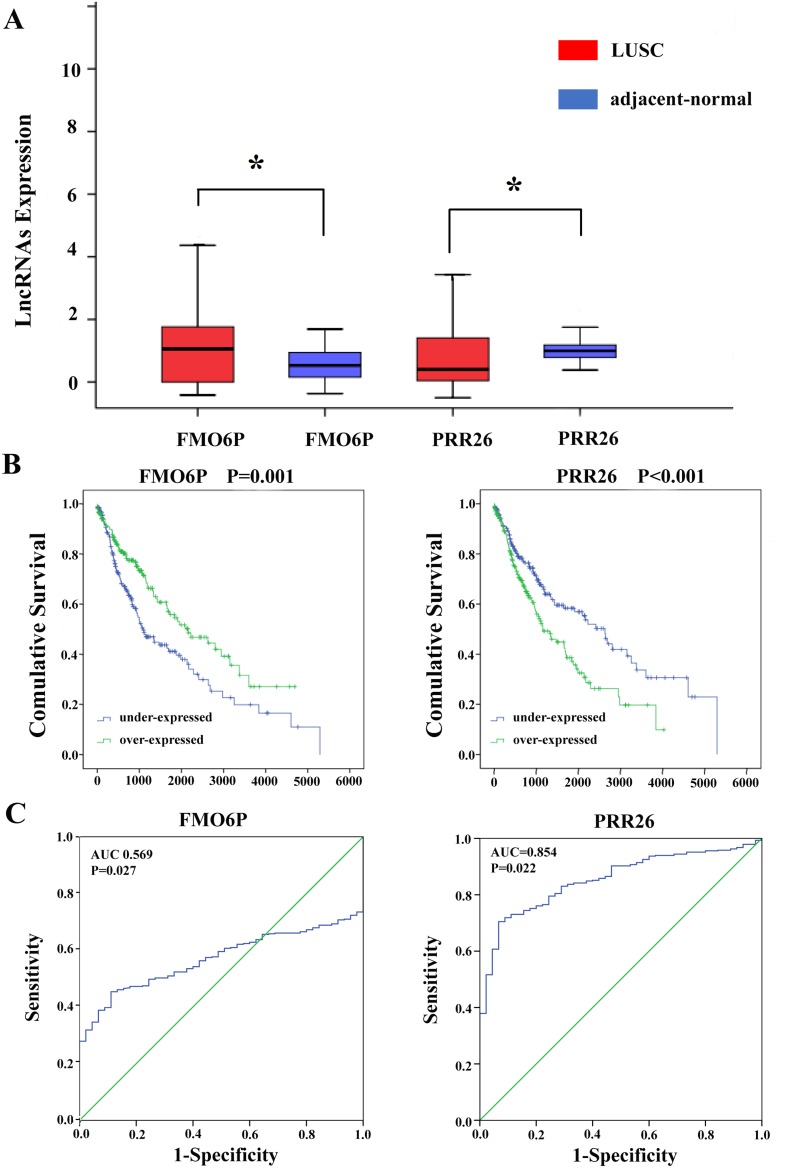
Figure 5. Two differentially expressed lncRNAs (FMO6P and PRR26).
(A) The expression levels of two lncRNAs in the LUSC tissues compared with adjacent normal tissues. (B) Kaplan-Meier curves showing the relationship between the two lncRNAs and OS. The cases were divided into under- and over-expression groups by the mean lncRNAs level. (C) ROC curves of the two lncRNAs to distinguish LUSC tissue from adjacent normal tissues.

